Using Automator
Upon logging into Automator, users are directed to a page where they can create an organization specific to their profile. After successfully creating an organization, users are then redirected to the Project Dashboard page, where they can initiate the creation of a new project.
Creating a First Suite
When starting with an empty project or when targeting specific segments of an application, you can create a new suite. If you haven't followed any order in reading this guide and find yourself unsure about what a suite is, refer to the Core Concepts section first, and then return here to create your initial suite.
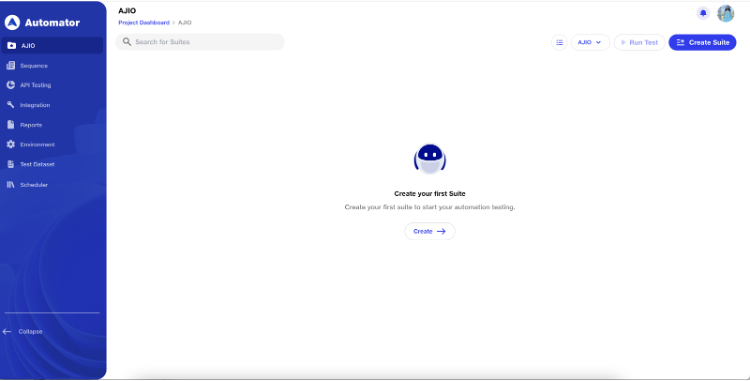
Click the "Create Suite" or "Create" button to initiate the process.
Provide a name for the suite, such as the flow you are testing, e.g., "Login Suite."
Next, select the desired browser, resolution, operating system, and preferred environment (Refer to the Environment section for more details).
Supported Browsers: By default, Chrome would be selected
- Chrome
- Firefox
- Edge
Supported Operating Systems: By default, Ubuntu would be selected
- Ubuntu
- Windows (For Enterprise users)
Supported Resolutions: By default, Full HD (1920x1080) would be selected
- Ultra-Wide 4K (3840×2160)
- Full HD (1920×1080)
- iPhone 8 Plus (414×736)
- Galaxy Note 20 (412×915)
Implicit Wait - Implicit wait waits for an element to appear on the page, allowing users to toggle it on/off as needed and select a time (up to 50 seconds, as implicit wait is supported) for the driver to wait before throwing an exception if the element is not immediately present.
Capture Screenshot – If the toggle is ON, enabling screenshots will be provided for every test step both before and after the execution, enhancing visibility and aiding in debugging for each step of the test.
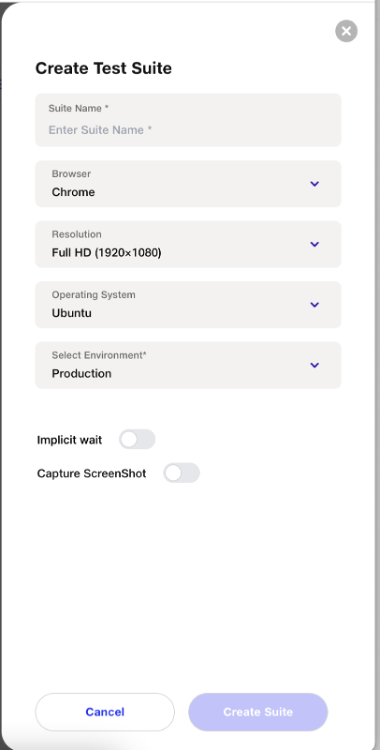
After entering the mandatory details, click on "Create Suite," and the suite will be successfully created.
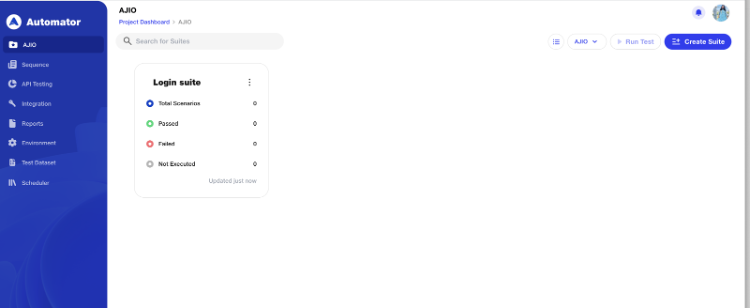
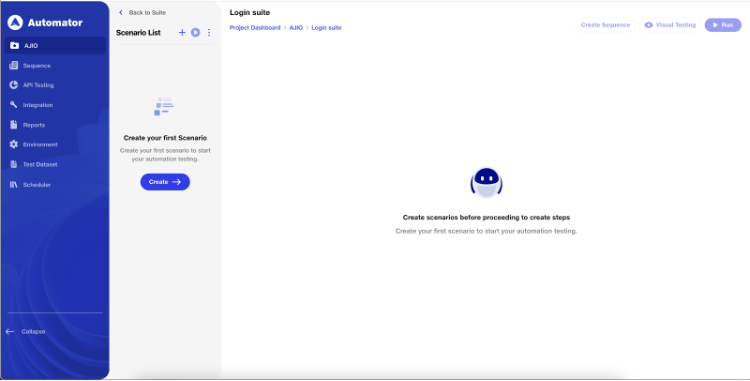
Since there are currently no scenarios created, the total number of scenarios is 0. To create a scenario within a suite, click on the suite and then either click on the "Create" button or use the add symbol.
-
Name the Scenario - Name the scenario based on the validations added for the specific flow.
-
Select Base Environment URL - Choose the Base Environment URL from the dropdown. Refer to the Environments section for more details.
-
Enter Tags - Add tags, such as "Sanity" or "Regression," to identify and filter scenarios for specific types of runs.
-
Selection of Persona Types -
- Single User - Focuses on testing the functionality and behaviour of an application assuming a single user interaction.
- Supported for all users.
- Multi User - Extends testing scope to simulate concurrent interactions from multiple users within the application.
- Automator supports up to 5 User Personas interacting with each other.
- Supported only for Enterprise Users.
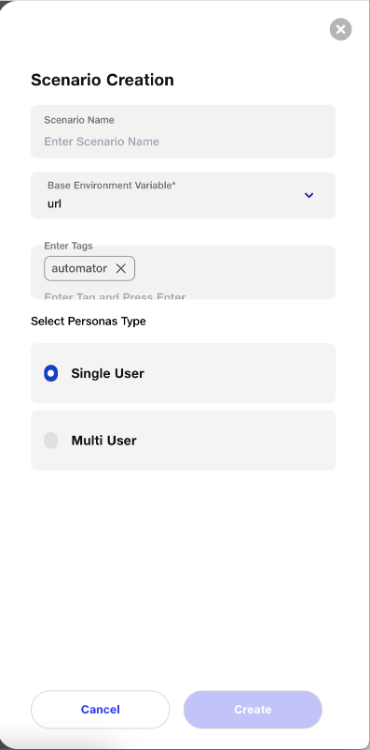
After creating a scenario, a navigation step will be automatically generated with the base URL provided for the selected environment. Additionally, the execution will initiate automatically once the scenario is created, streamlining the testing process.
Visual Testing
Automator’s live authoring transforms the test-building and maintenance experience by giving you unprecedented control over the execution. With this feature, you can:
- Witness instant results of your actions within each step;
- Command your dedicated browser in the cloud, ready for your instructions;
- Boost confidence in step functionality for seamless re-execution;
- Investigate deeply using Chrome DevTools functionalities;
- Take command of the browser, interacting with your page dynamically; and much more!
In a live session, newly added steps instantly run on an interactive browser on the right-hand side. Users report a dramatic acceleration in test authoring and maintenance—10-100x faster—saving considerable time and effort.
Whether you are building your journey for the first time or maintaining an existing one, you would wish to know whether the step you just added or changed works. Visual testing helps you achieve just that.
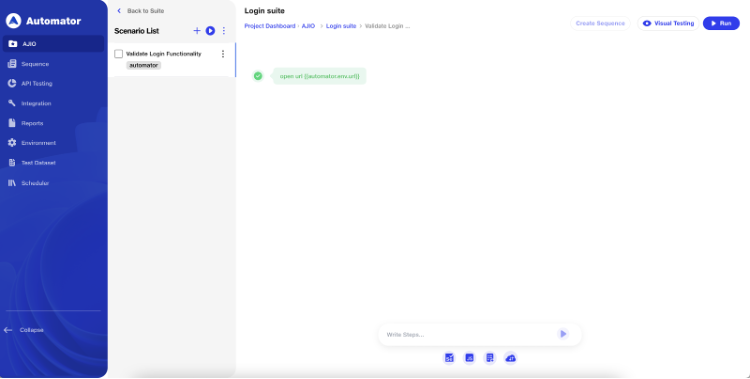
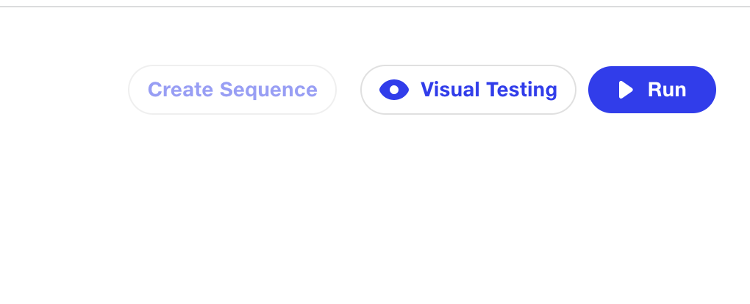
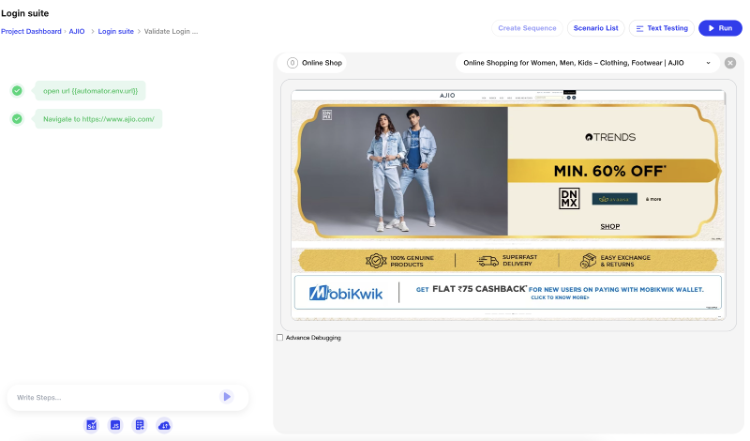
After creating your journey, you will notice the visual testing Button on right side of the execution screen, which you can command to run your journey, if Automator already has not done so.
Once Clicked on Visual Testing, the live Preview Session will seamlessly track your Scenario as you construct it.
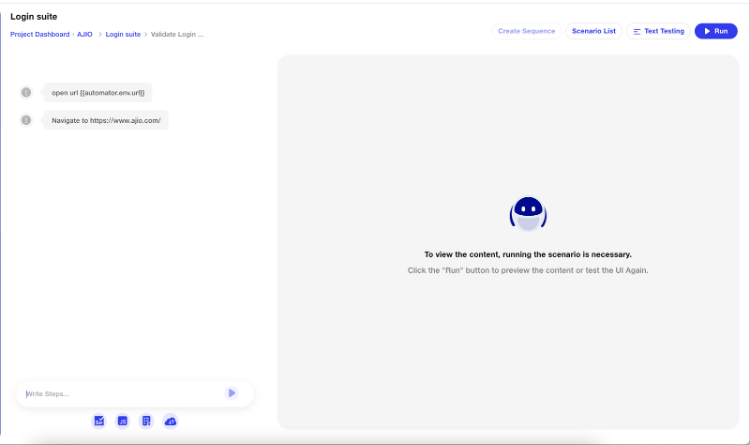
Upon running the scenario, you can observe the execution of the test steps outlined in the scenario.
NOTE - Visual testing is exclusively supported on the Chrome Browser. For FireFox and Edge Browsers, Text testing is available as an alternative.
Text Testing
If you wish to temporarily disable the Visual testing feature, you can do so by clicking on the Text testing. The Visual testing will remain inactive in your browser until you decide to re-enable it. To turn it back on, simply click the "Visual Testing" button, which is displayed when the feature is turned off.
Create Test Steps Through Context Menu in Live Preview -
Right-click in Live Preview: To precisely create a step in the Live Preview area, position your cursor at the desired location within the Live Preview interface. Right-click at this specific location to reveal the context menu and proceed with creating the test steps as needed. This allows you to have control over the exact placement of the steps in the Live Preview.
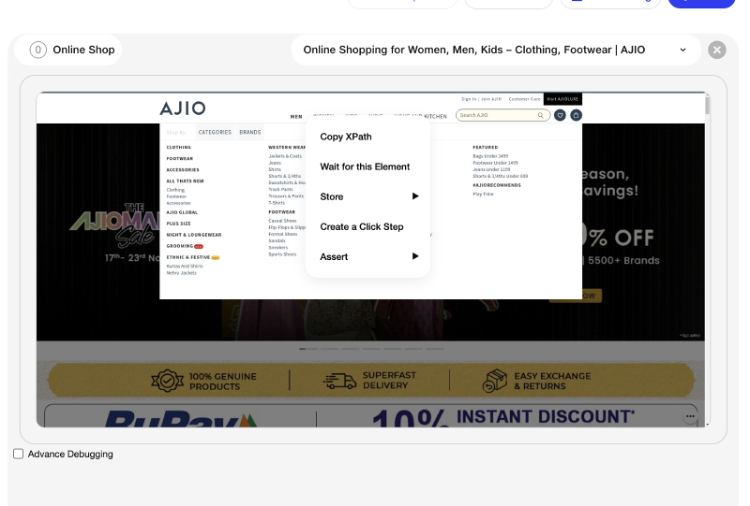
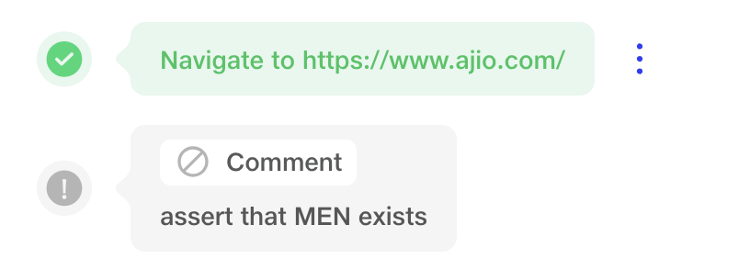
Select the preferred option based on your requirements, such as creating a click step, write step, storing text or attribute, copying XPath, asserting equality or inequality, asserting text, or waiting for an element with a specified wait. This flexibility allows you to tailor the test steps to match the specific actions and validations needed for your scenario.
Just go ahead and create new steps; witness their execution unfold seamlessly.
When you click on an option, a natural language step will be generated, specifically targeting the element you are interacting with.
Examples -
Assert that MEN exists
Click on WOMEN
![]()
This approach streamlines the process of generating test steps directly within the live preview, enhancing the efficiency of your test creation.
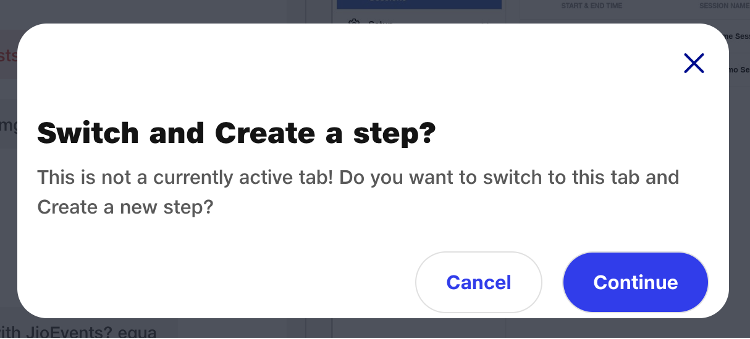
Context Menu behaviour When working with Multiple Tabs -
When dealing with multiple tabs in your Scenario, especially when commands open links in new tabs, Automator maintains a focus on a single tab at any given moment. Despite having the ability to switch between tabs for an interactive preview,Automator will indicate the currently focused tab by displaying a highlights the tab. This visual cue helps you stay aware of the active tab during your testing process.
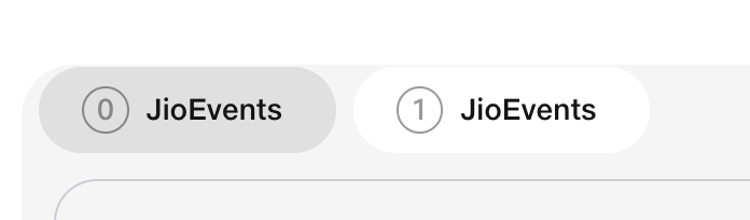
Additionally, when working with the interaction menu, Automator will automatically include the necessary steps to switch to your active tab if Automator was previously focused on a different tab. This ensures a smooth and context-aware transition during your test steps.
Quick Heal
If a test step fails to locate an element on the screen or encounters any other issue, you can rectify the step using the "Quick Heal" option. While writing a test step and executing it through the live preview, if the step fails, click on the "Quick Heal" option. Subsequently, hover over the correct element, and then click on it to swiftly address and resolve the issue. Upon modifying a Selector of the step through the Quick heal, the live browser will initiate an automatic re-execution of the step.

//need to add a video here –quick heal
Quick Heal supports specific intents where the element is interactive through the live preview.
Supported Intents – scrollToElement, MouseHover, getText, assertexists, input, assertnottext, assertnotexists, click, asserttext, waitFor, Radio, Select
AUTO FIX - As your tests run over time, Automator will autonomously uphold and rectify the underlying selectors for elements, ensuring the continuity and effectiveness of your tests.
By default, Auto Fix is selected for every test step, ensuring automatic correction and maintenance of elements as your tests progress.
The condition for Auto Fix is as follows: When a step is Quick Healed or created through the Context Menu, five selectors are stored—Visible text, full XPath, absolute XPath, ID, and CSS. In future releases, if the ID changes, the step won't fail as long as at least 50% of the selectors match if the Auto Fix is ON. This criterion ensures that Quick Heal continues to work effectively even if one or more selectors undergo changes.
Advanced mode and Dev Tools -
This toggle in the interactive preview activates the advanced mode:
![]()
Advanced mode grants you enhanced access to the browser, incorporating features like developer tools (familiar from Dev Tools)
This mode empowers you to leverage the same capabilities available in Dev Tools for in-depth debugging during testing. For instance, you can inspect elements, analyse network traffic, review console logs and errors, monitor page memory and performance, and more. Explore these functionalities in the following sections.
Inspect Elements
The Elements tab provides an insight into the HTML structure of the page, offering versatility for different scenarios:
- Hover over specific HTML elements to visually highlight them in the interactive preview.
- Select an element to access its properties, including details about its styling.
- Right-click on an element to copy its XPath or CSS Selector.
![]()
CONSOLE
The Console tab offers a comprehensive JavaScript console, enabling you to:
- Review console logs or errors generated by the application and delve into their details.
- Manually execute JavaScript code or invoke functions, beneficial for crafting expressions.
- Examine the values of existing JavaScript variables in the browser.
Source Viewer
The Sources tab provides visibility into the JavaScript sources loaded by your page. Utilizing this feature, you can:
- Examine the code currently running in the browser at a specific point.
- Establish breakpoints by clicking on the line number of any code line. This action causes the browser to pause when it reaches that line, facilitating detailed debugging of the script in its present state.
Network Monitoring
The Network tab enables you to oversee and manage network requests initiated and received by the browser. This includes the ability to:
- Monitor API calls made by the page; clicking Fetch/XHR and selecting a specific request reveals detailed information such as headers, payload, and the browser's response.
- Scrutinize resources loaded on the page, examine the timing of requests, and identify potential bottlenecks in your application.
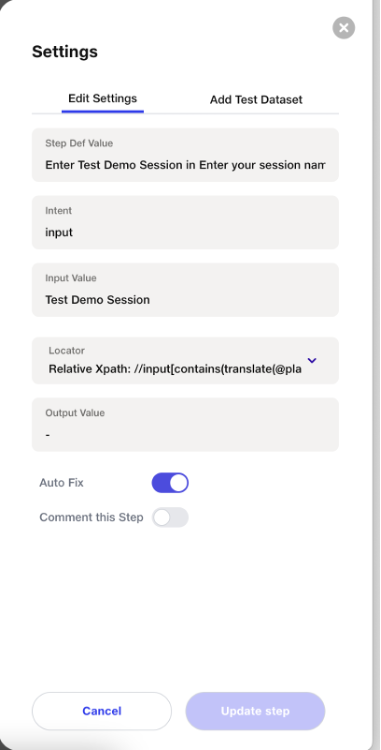
Test step Settings
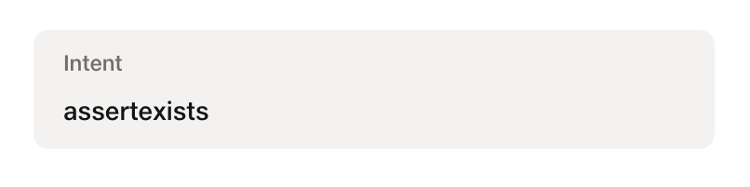
When you input a test step in Natural English language, the machine learning system will interpret the statement and break it down into three components:
- Intent: This signifies the specific action to be performed and is not editable.
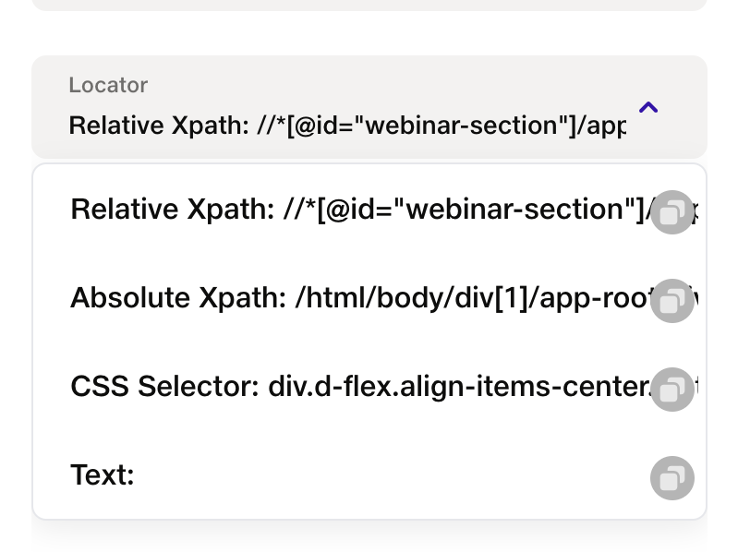
- Name: This identifies the element within the system or browser that will be involved in the interaction and is not editable.
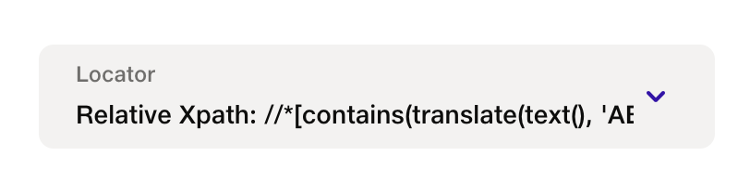
Locators Supported by Automator – Relative Xpath, Absolute Xpath, CSS and Visible text.
- Value: This represents the input value or explicit data that will be entered into the fields. The only editable part is the value, allowing customization of the input for the specified action and element.
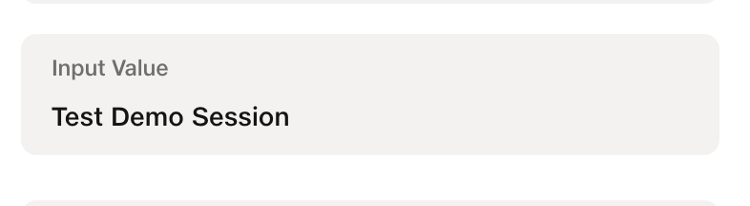
When the input value is modified, the corresponding step definition will be automatically updated. This ensures that any changes made to the input value are reflected in the step definition, maintaining synchronization between the natural language instruction and the underlying code. This automated updating process helps streamline the workflow and ensures that the test steps accurately represent the intended actions with the updated values.
In essence, this process transforms the natural language instruction into a structured format, delineating the intention, the relevant element, and the associated value for seamless execution.
Comment step
If a step is commented, it means that the commented step will not be executed when the scenario runs. Specifically in below conditions:
- Step Commented in a Scenario - If a step is commented within a specific scenario, only that instance of the step in that scenario will be ignored during execution. Other occurrences of the same step in different scenarios or parts of the project will still be active. The test step can be step, JavaScript, Selenium script and API call
- Sequence Commented in a Scenario - If an entire sequence is commented within a scenario, only the sequence added to that scenario will be commented out. Other sequences in different scenarios or parts of the project will remain unaffected.
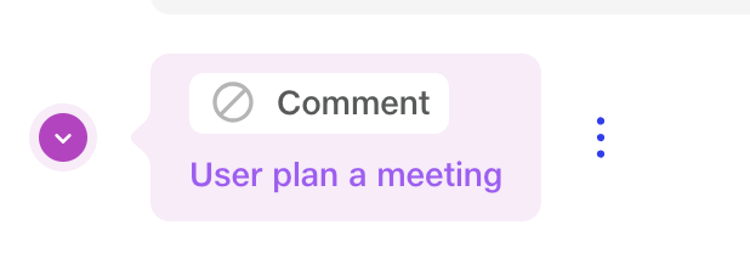
- Sequence Test Step Commented - If a test step within a sequence is commented, it will affect all occurrences of that sequence throughout the project. Any use of the sequence, regardless of the scenario, will have the commented test step excluded from execution.
![]()
These commenting mechanisms provide a way to control the execution flow at different levels of granularity, from individual steps within a scenario to entire sequences across scenarios in a project.
Domain Whitelisting
Domain whitelisting restricts testing to approved domains to maintain a secure and controlled environment. This prevents interaction with unverified or potentially malicious URLs on the platform. It ensures safer testing workflows and protects system integrity.
1) Domain Whitelisting Rules
a) Approval Rights: Admins have full rights to approve or reject any incoming domain access requests.
b) Top-Level Domain (TLD) Handling: If an admin adds a TLD pattern such as *.jio.com, there is no need to individually whitelist other subdomains or the root domain (e.g., api.jio.com, test.jio.com, or jio.com itself). Any URL ending with jio.com will automatically be considered whitelisted and can be used across the project without restrictions.
c) Execution Access: Admins and other users can use URLs ending with the whitelisted TLD (e.g., *.jio.com) throughout the project, and such domains will execute successfully during testing due to their whitelisted status.
d) Request Notification: When an invited user requests access for a new domain, the admin receives a notification message: [User_Name] has requested a domain. Please review and take action. Clicking on the hyperlinked domain name in the notification will redirect the admin to the Domain Access tab, where they can take appropriate action.
 e) No Additional Approval Required: Admins can whitelist domains directly without requiring further approval from others.
2) Opening Domain Whitelisting Page
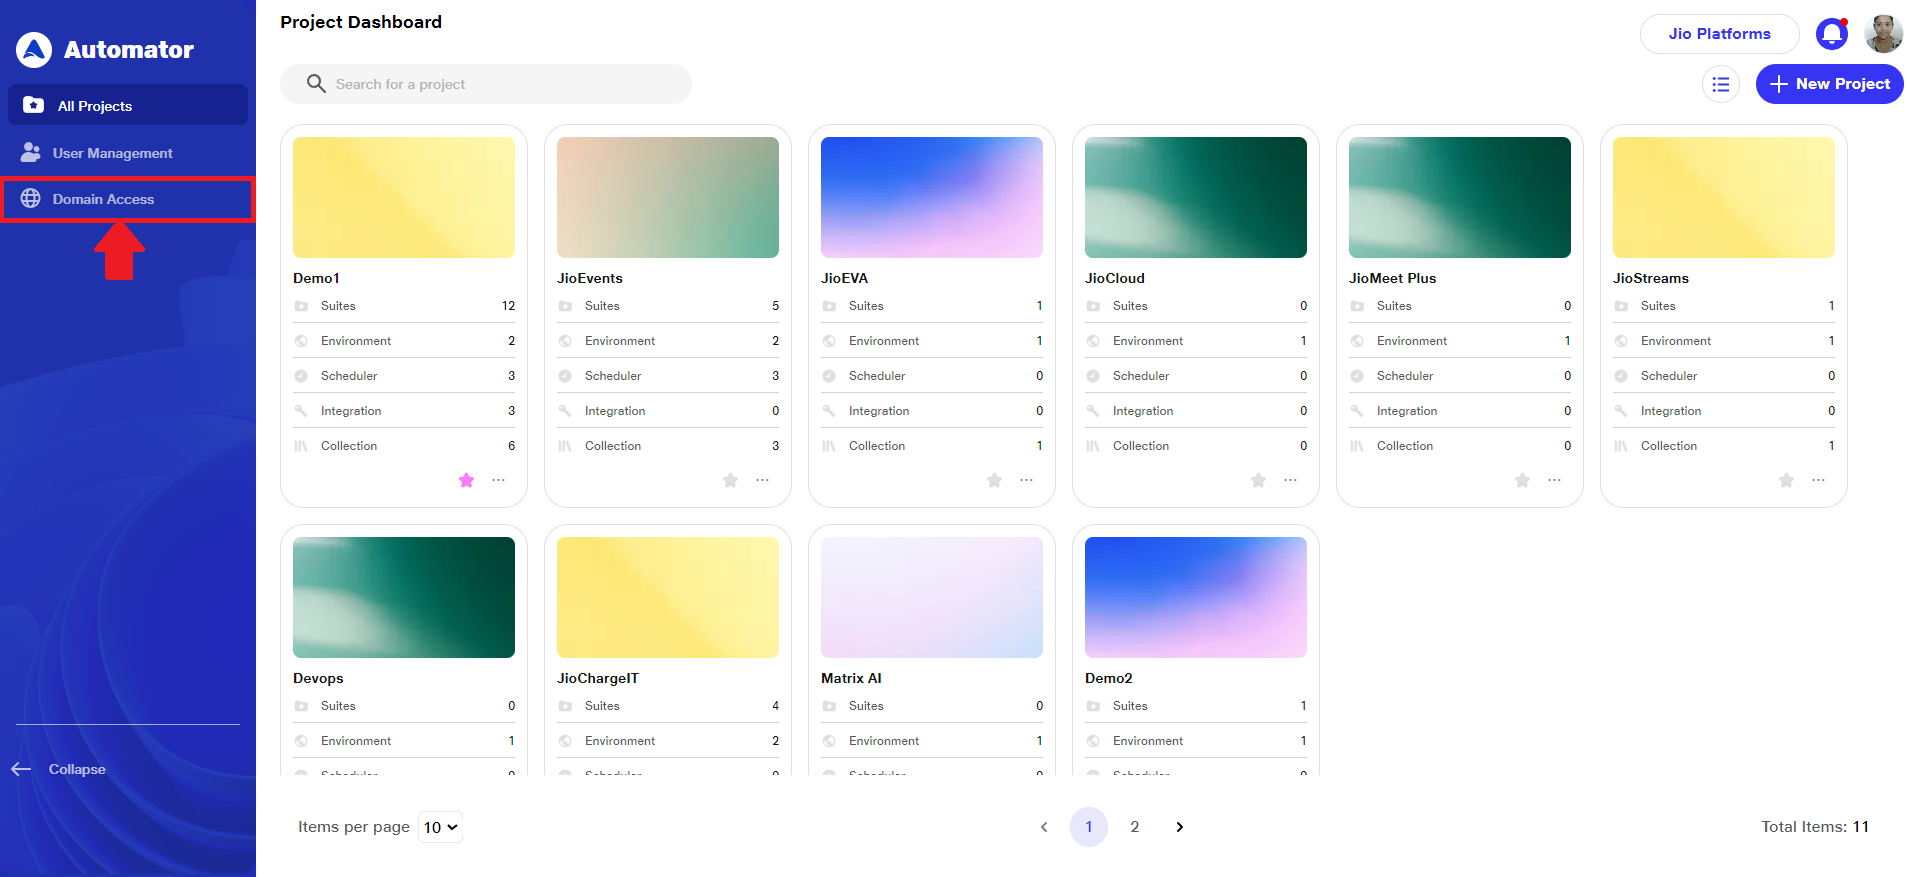
a)After logging in to the platform, locate the left-hand side menu on the Project Dashboard page.
b) From the menu options, click on Domain Access to proceed to the domain whitelisting settings.
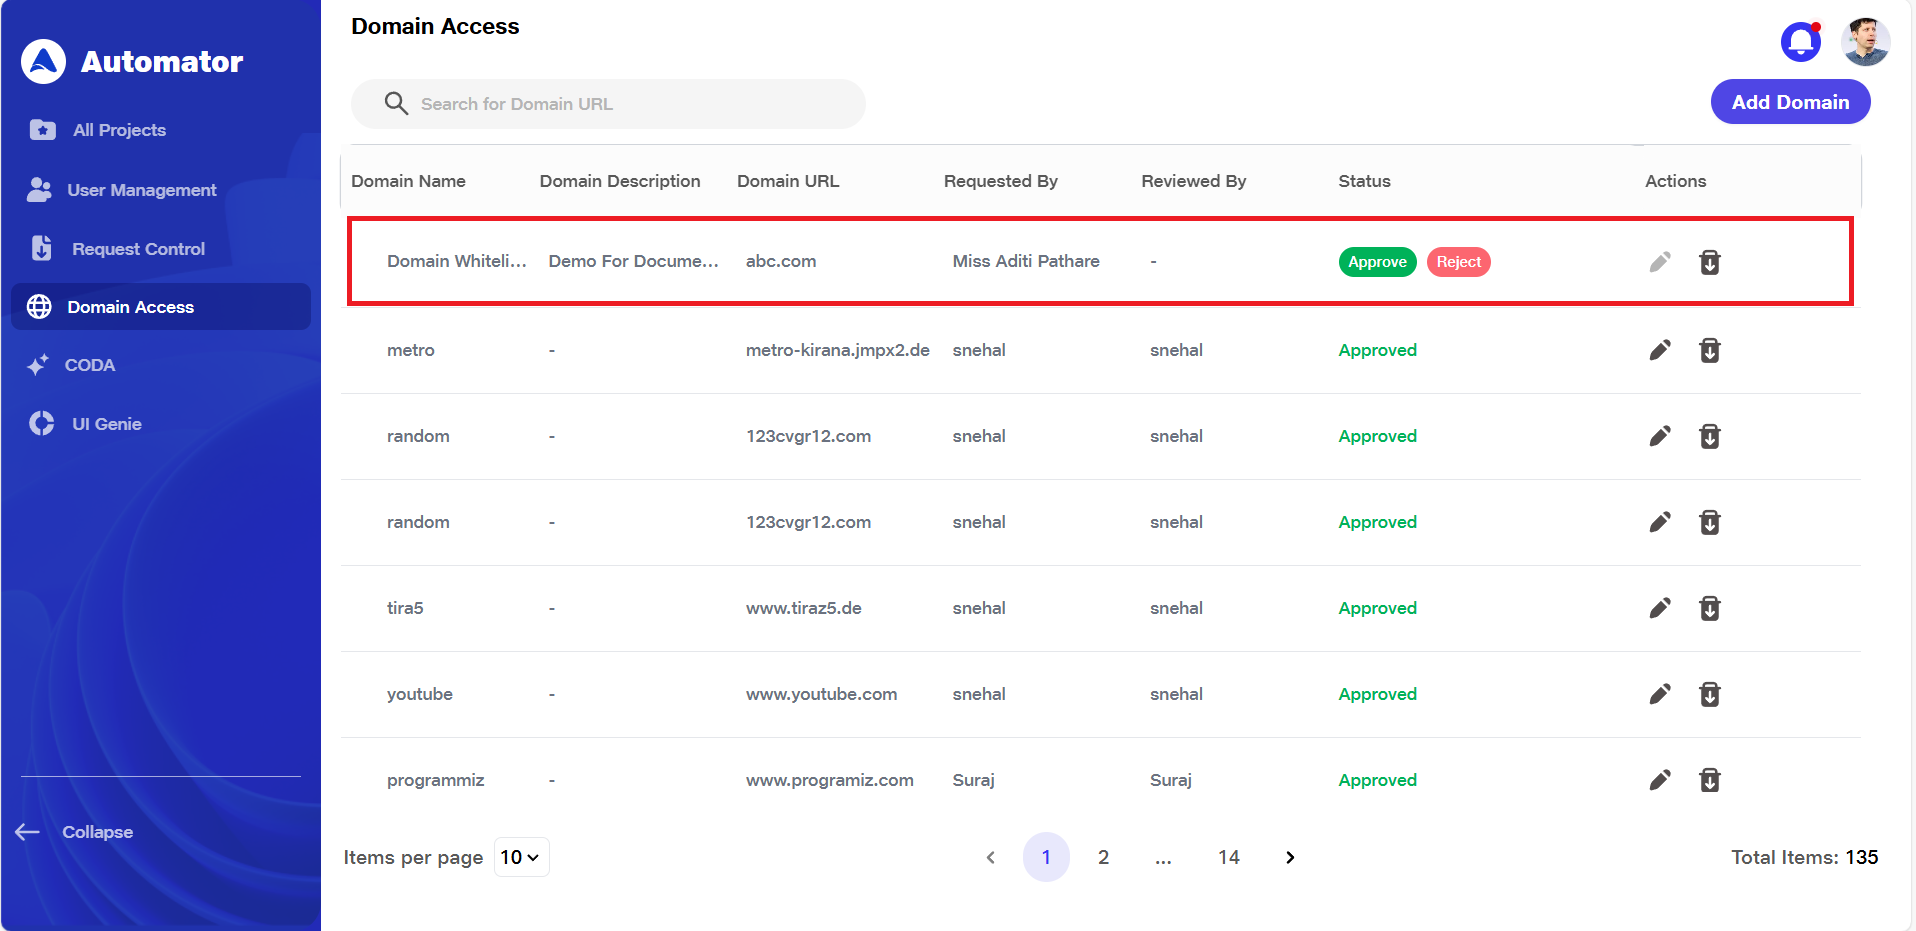
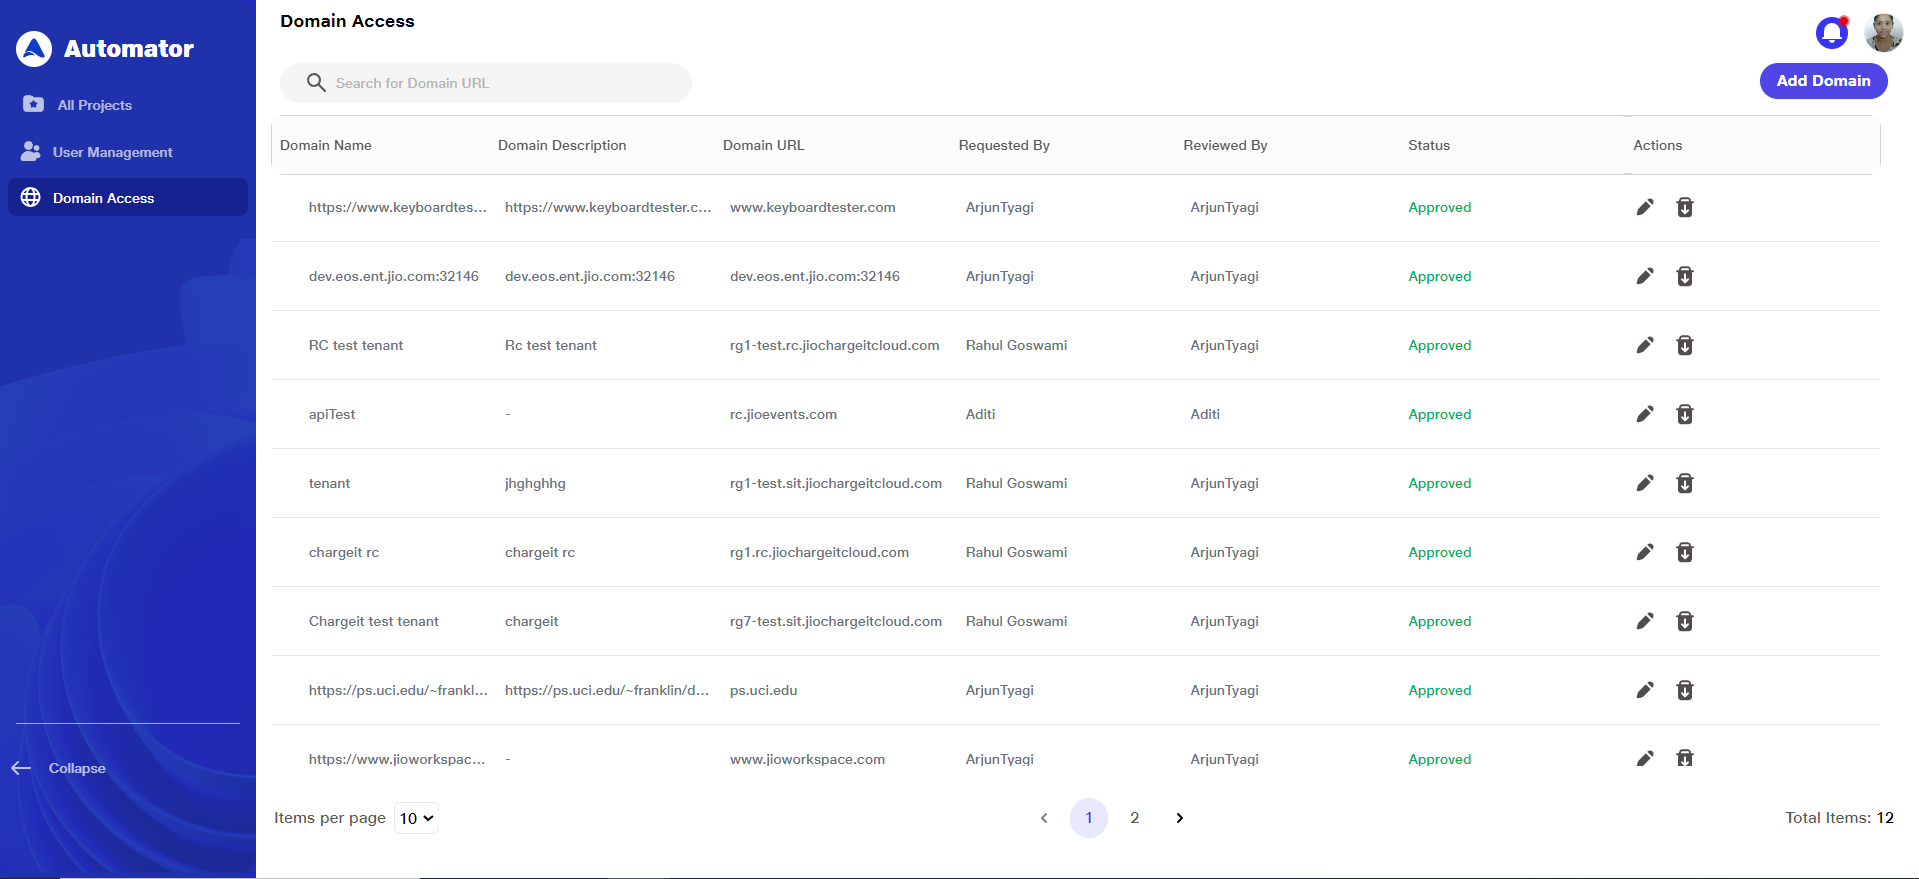
3) Domain Access Page Overview
a)Once on the Domain Access page, you will see a list of all domains currently whitelisted for the projects.
b) This page allows you to view, add, or remove domains from the whitelist.
c) It ensures that only approved domains are permitted during testing.
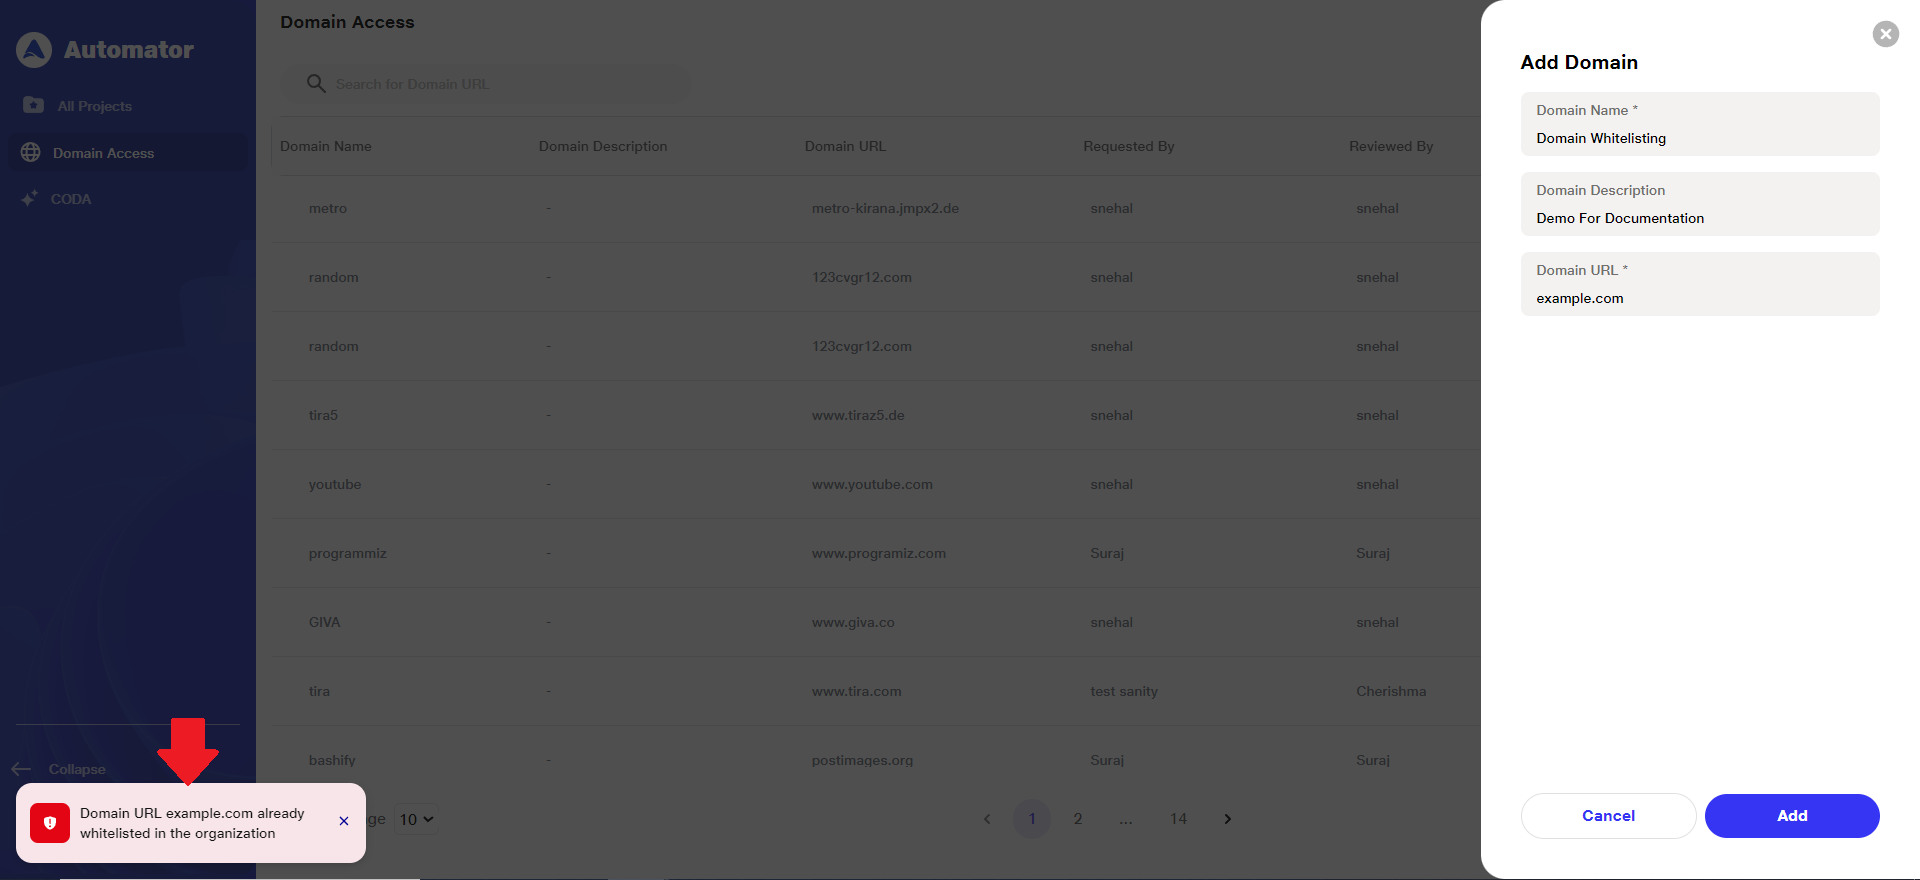
4) Whitelisting New Domain
a)Click on the Add Domain button located at the top-right corner of the Domain Access page.
b)A popup will appear prompting you to enter the following details:
i) Domain Name – Provide a recognizable name or identifier for the domain.
ii)Domain Description – Enter a brief explanation of the domain’s purpose or usage context.
iii) Domain URL – Input the full URL of the domain you wish to whitelist (e.g., https://example.com).
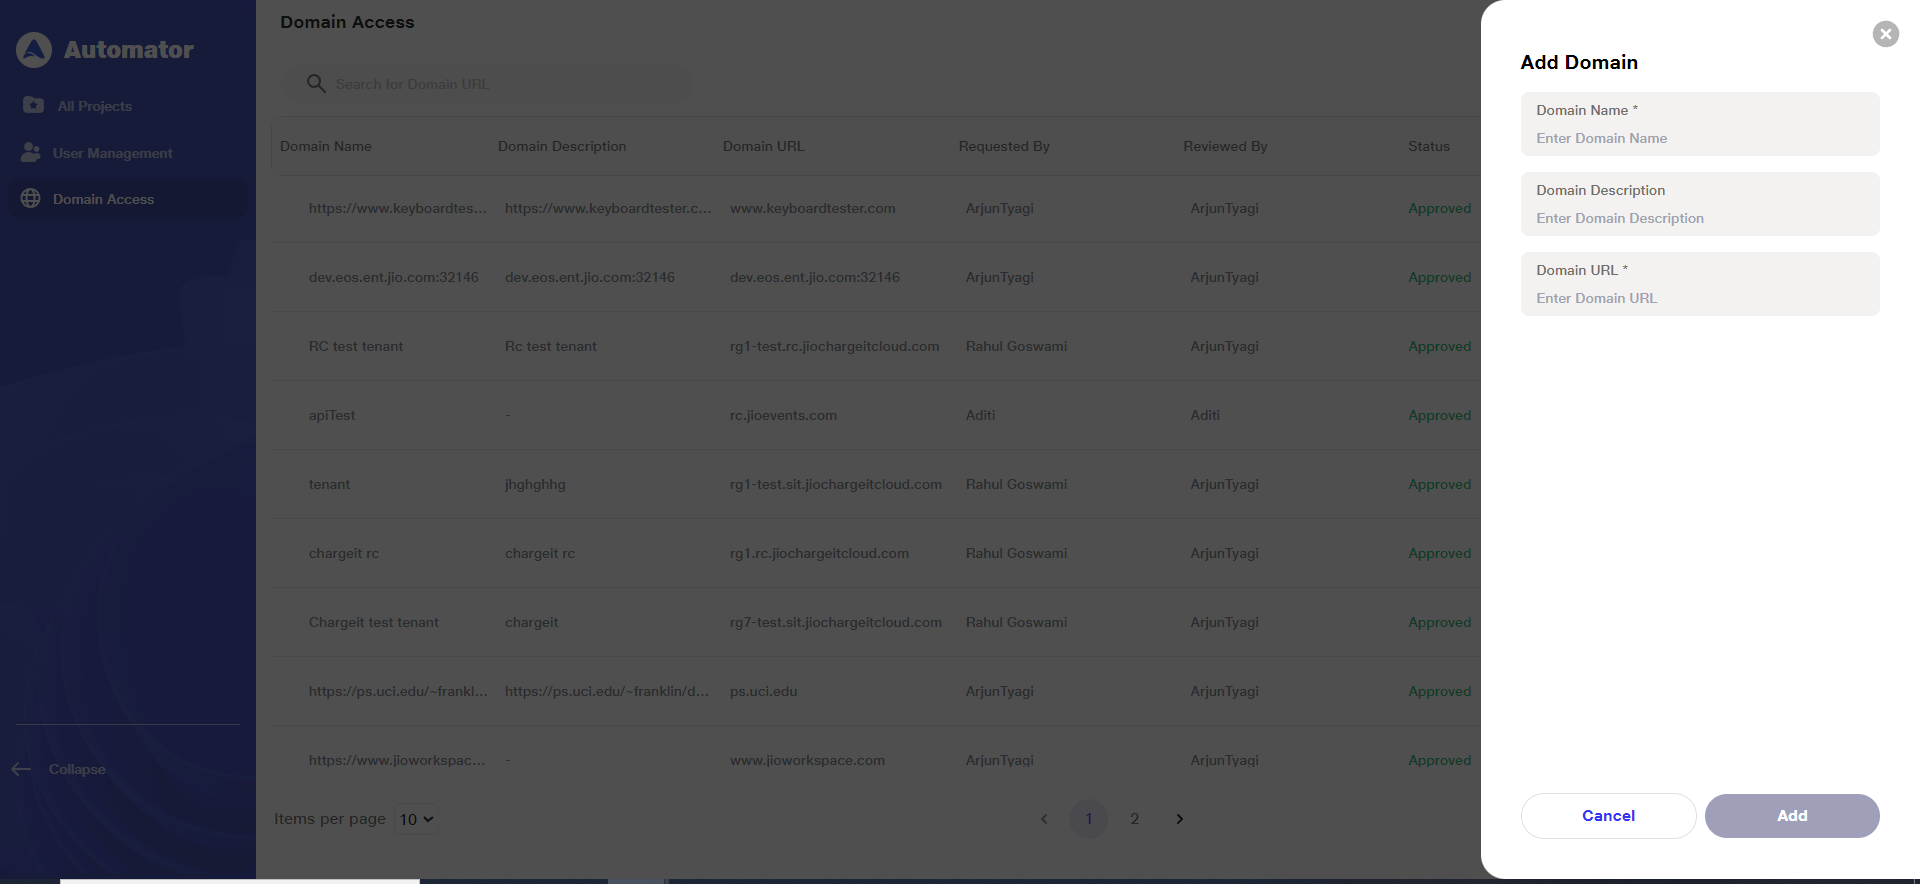 c) Note: The fields of Domain Name and Domain URL are compulsorily required to successfully submit a new whitelisting request.
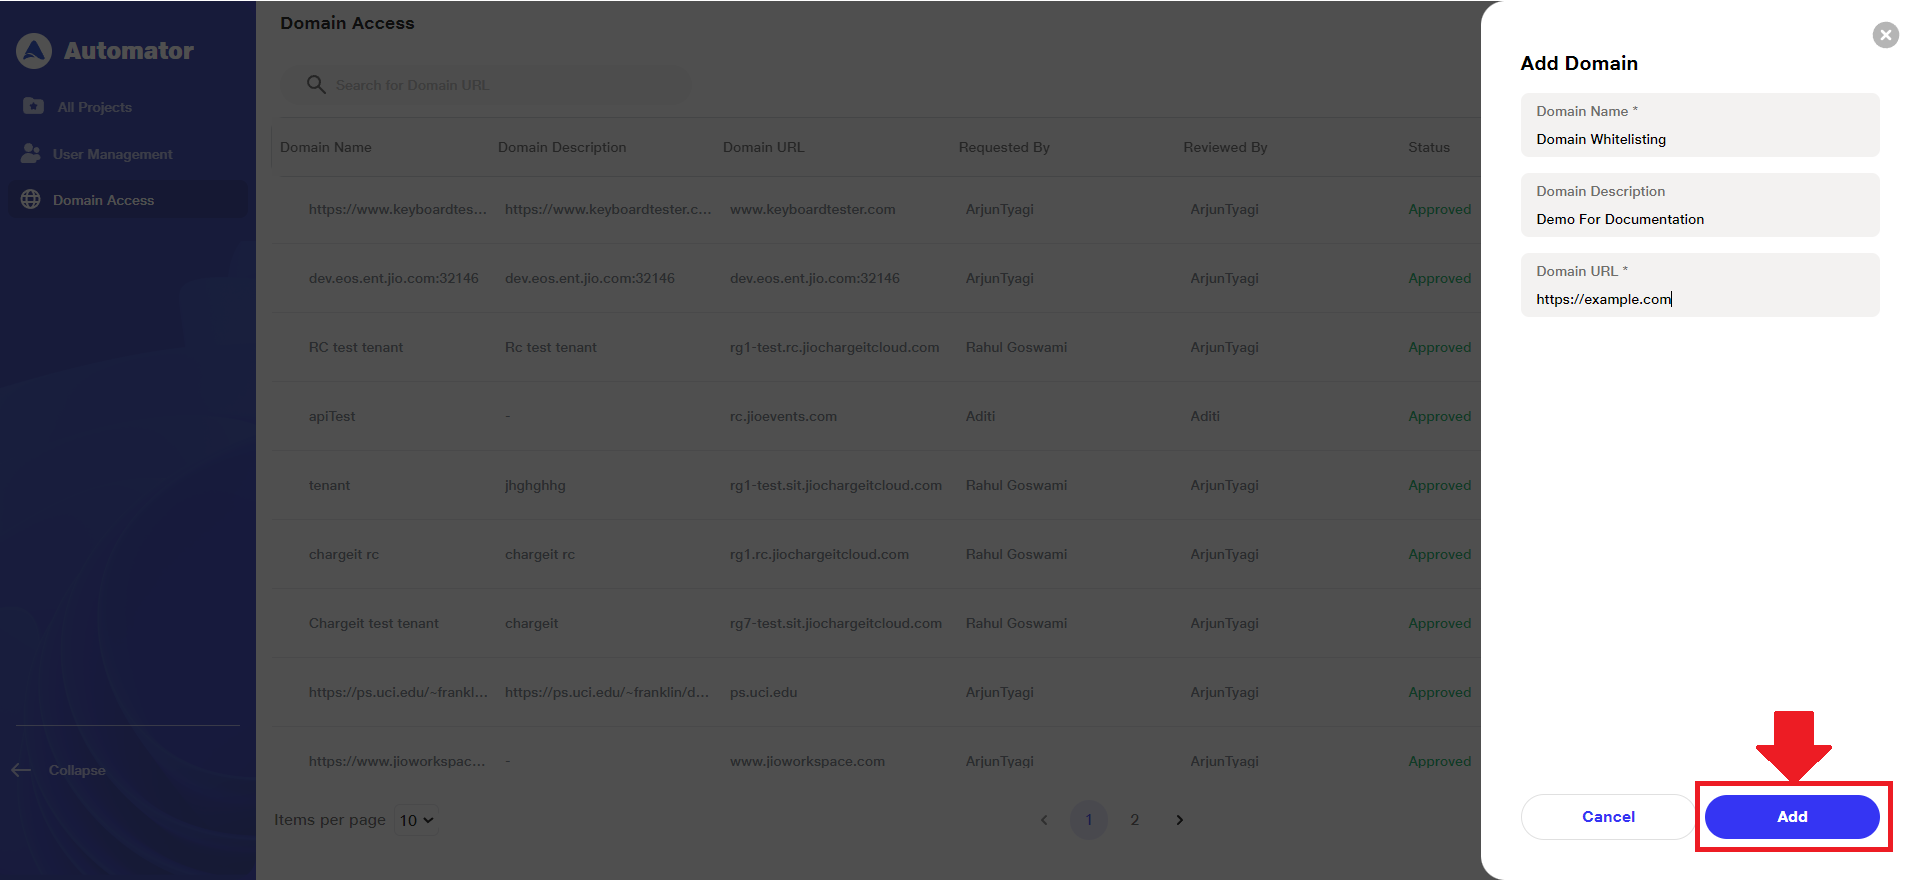
d) After filling in all required fields, click the Add button to send the request for Admin approval.
 e) If the domain (hostname) is already whitelisted, an alert toast will appear at the bottom-left corner of the screen with the message: Domain URL hostname (for e.g., example.com) already whitelisted in the organization.
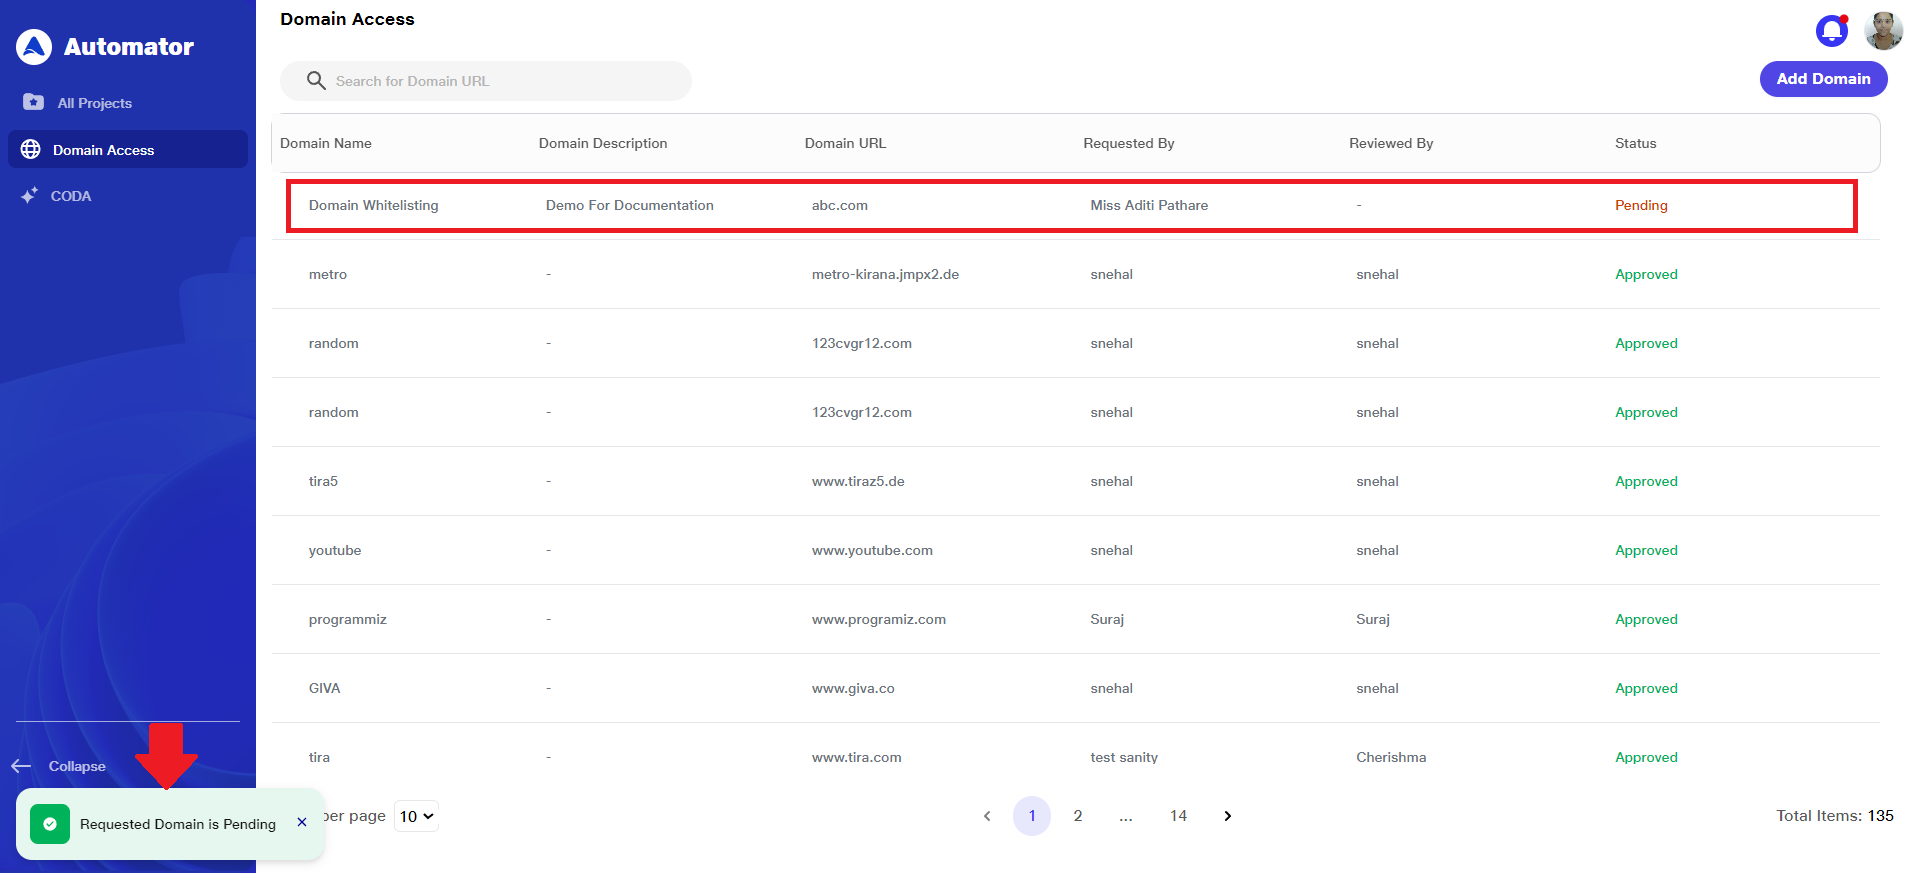
 f) Once submitted, Request Domain is Pending alert popup will come at the bottom left corner and the new domain will appear in the list with a status of Pending until it is reviewed and either approved or rejected by an authorized user.
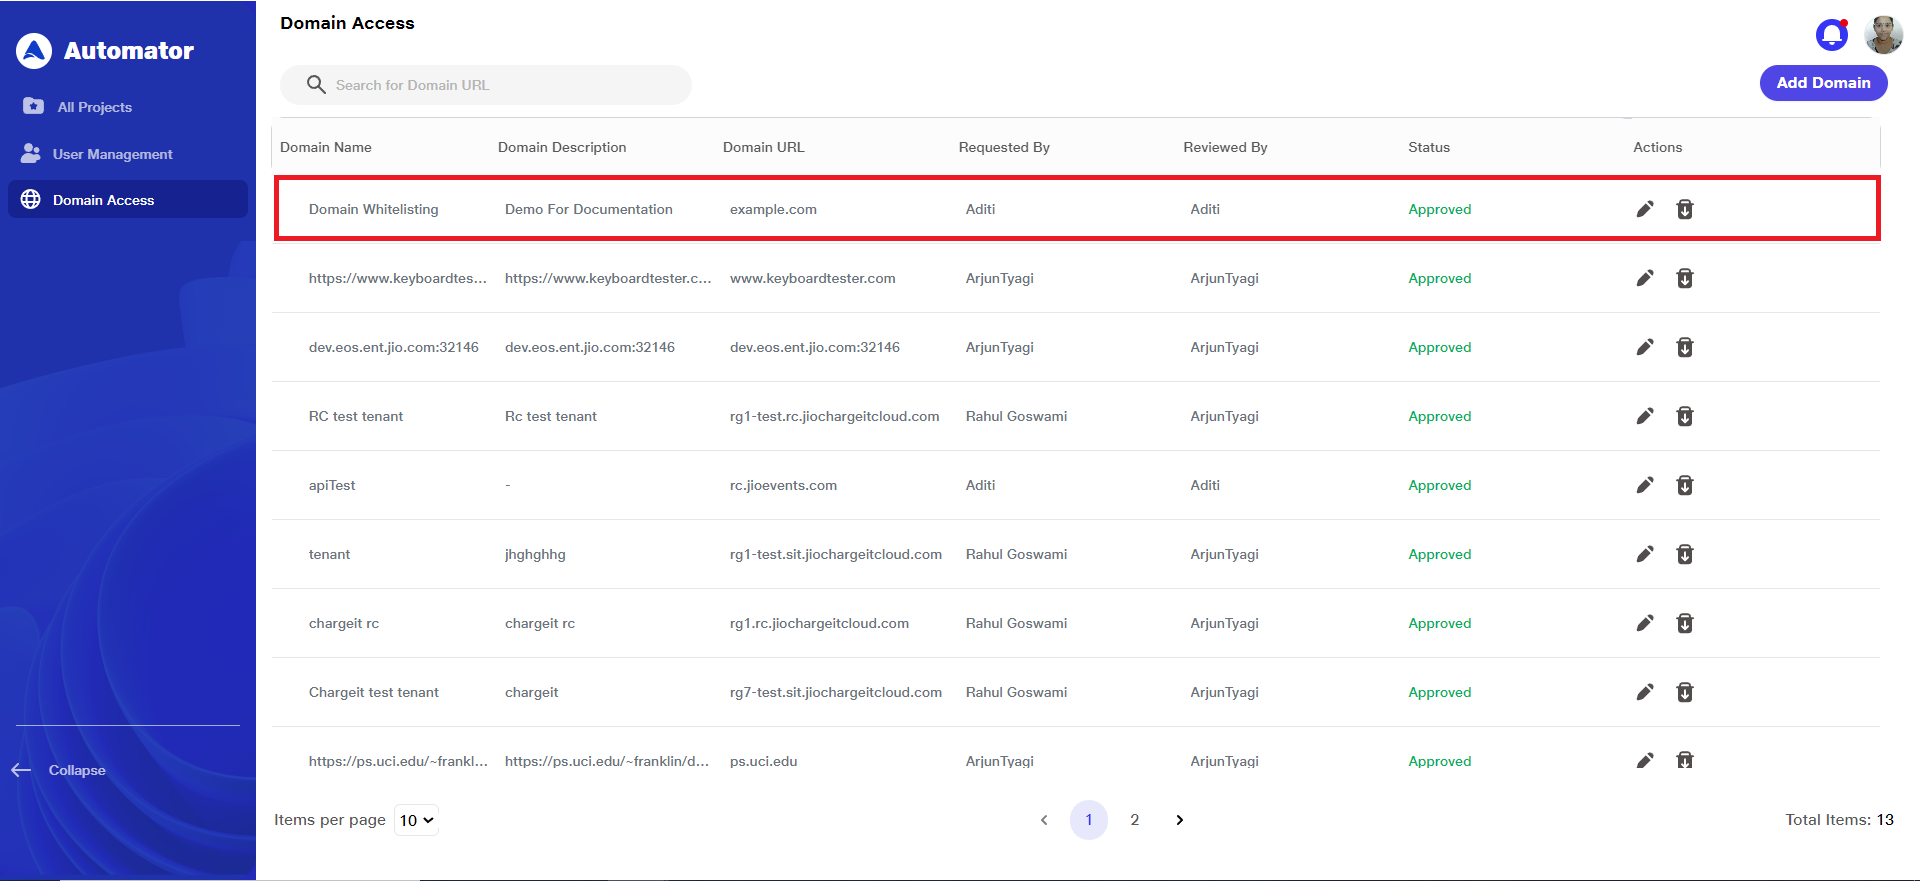
 g) Refer to the Approved State Image to see how a successfully approved domain is displayed in the list:
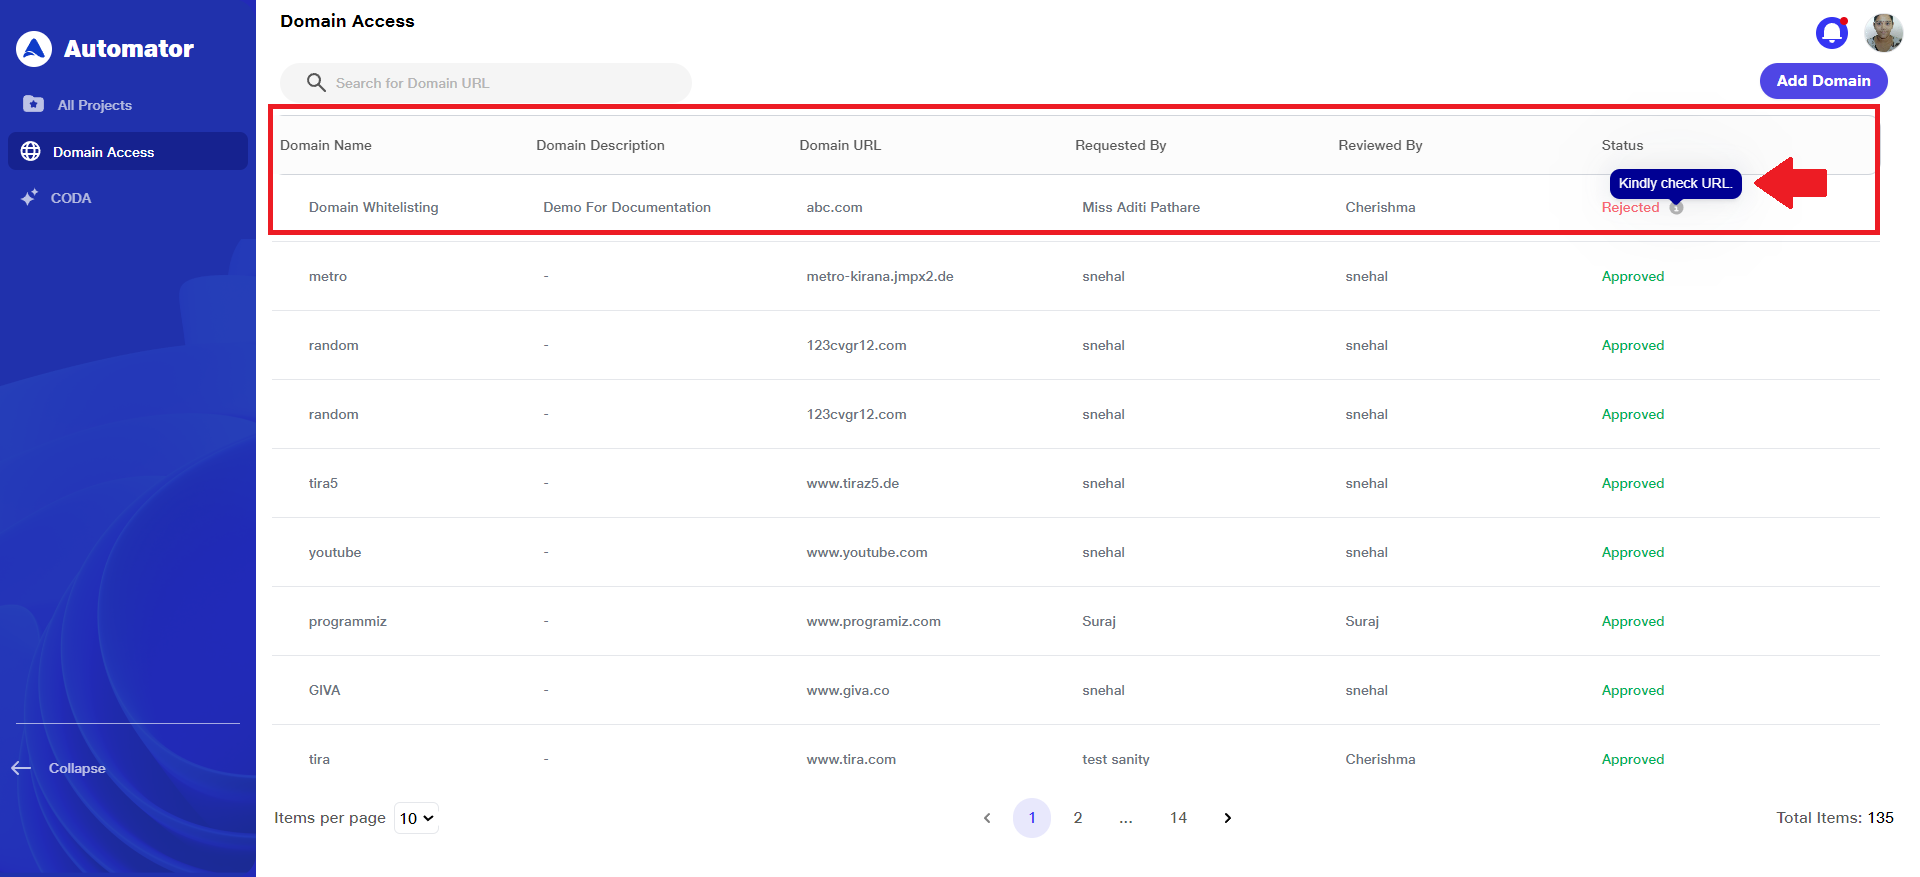
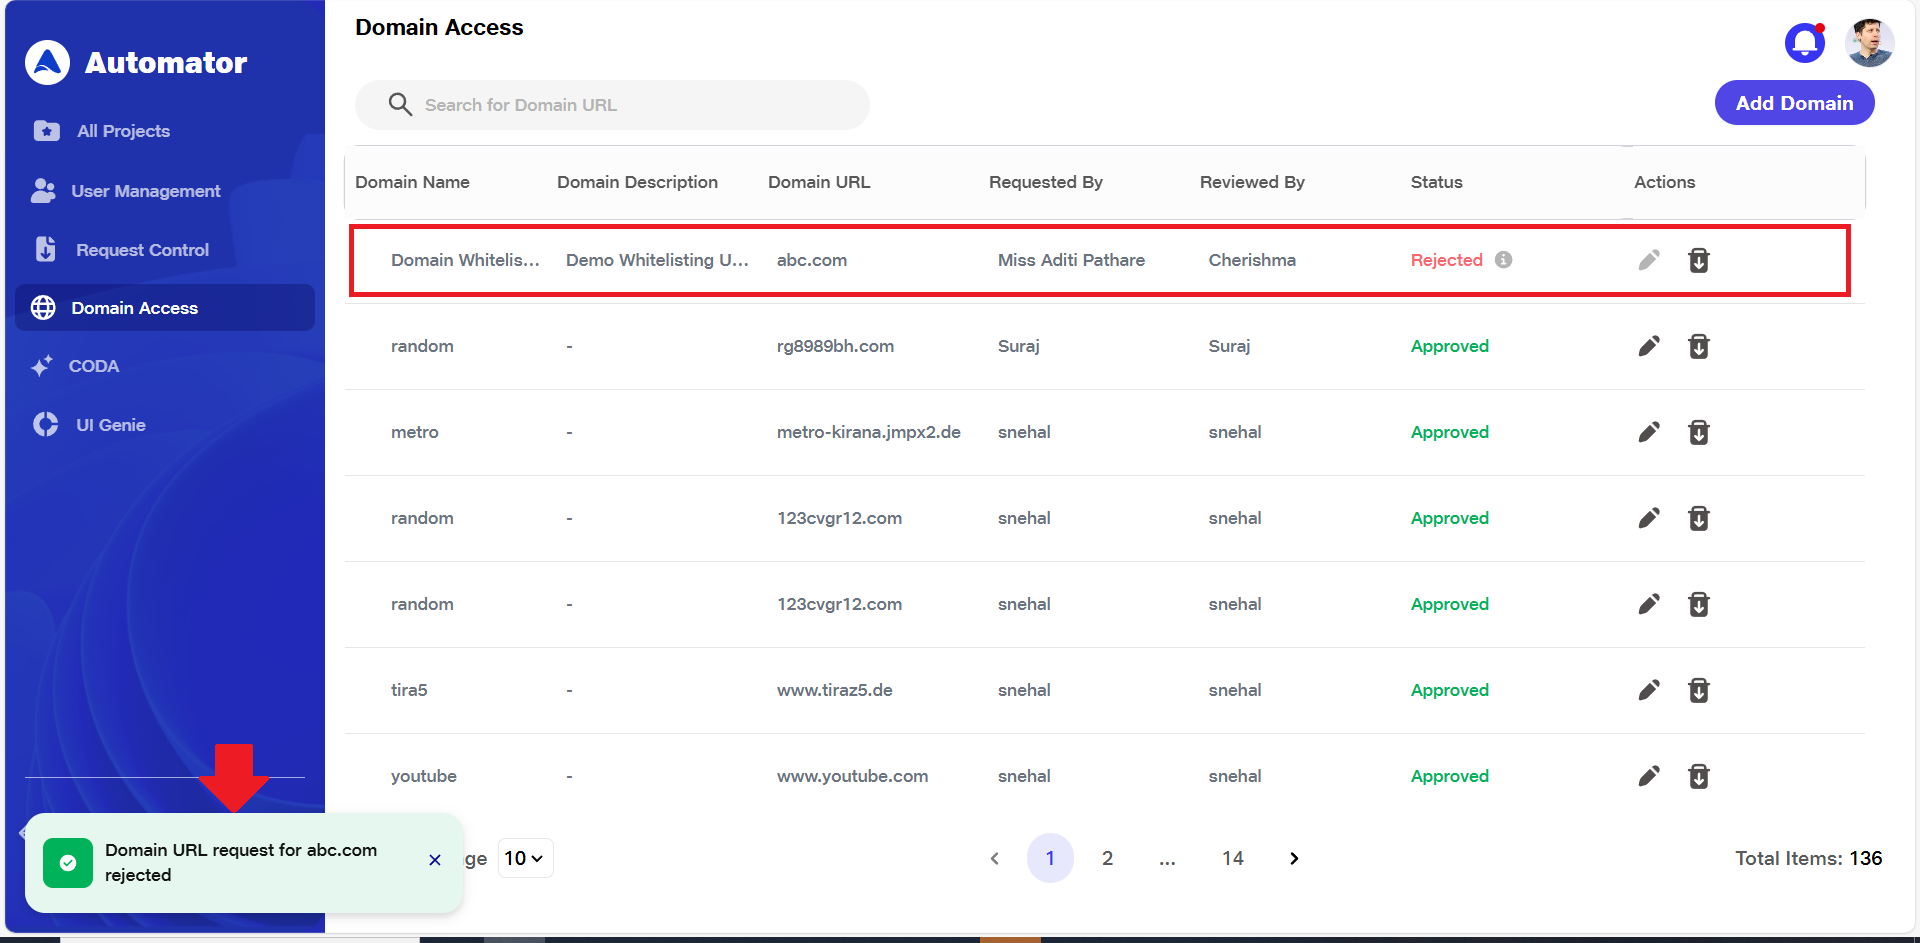
 h) Refer to the Rejected State Image, where:
i) The Status column mentions the value Rejected.
ii)An information icon (i) appears next to the status Rejected.
iii)Hovering over the i icon reveals the reason provided by the admin for rejecting the domain.
5) Admin Request Page:
a) The admin receives a notification message for the user requesting access for a new domain: [User_Name] has requested a domain. Please review and take action.
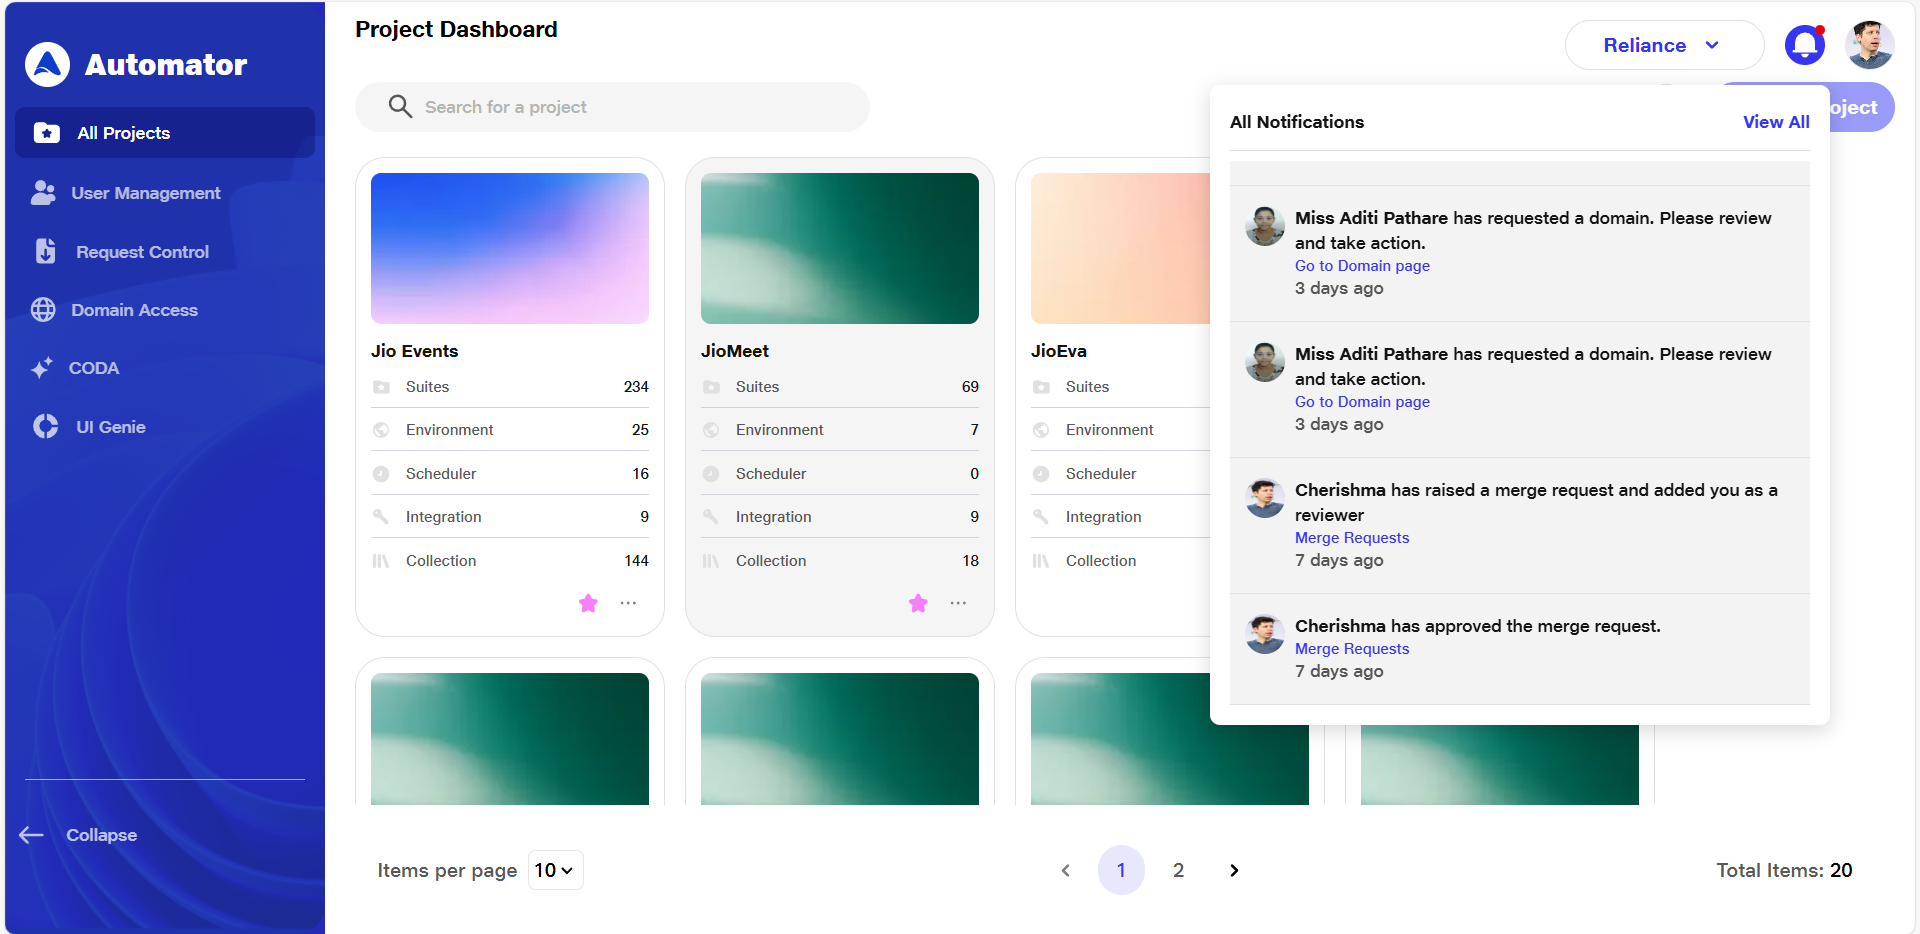 b) Clicking on the hyperlinked domain name in the notification will redirect the admin to the Domain Access tab.
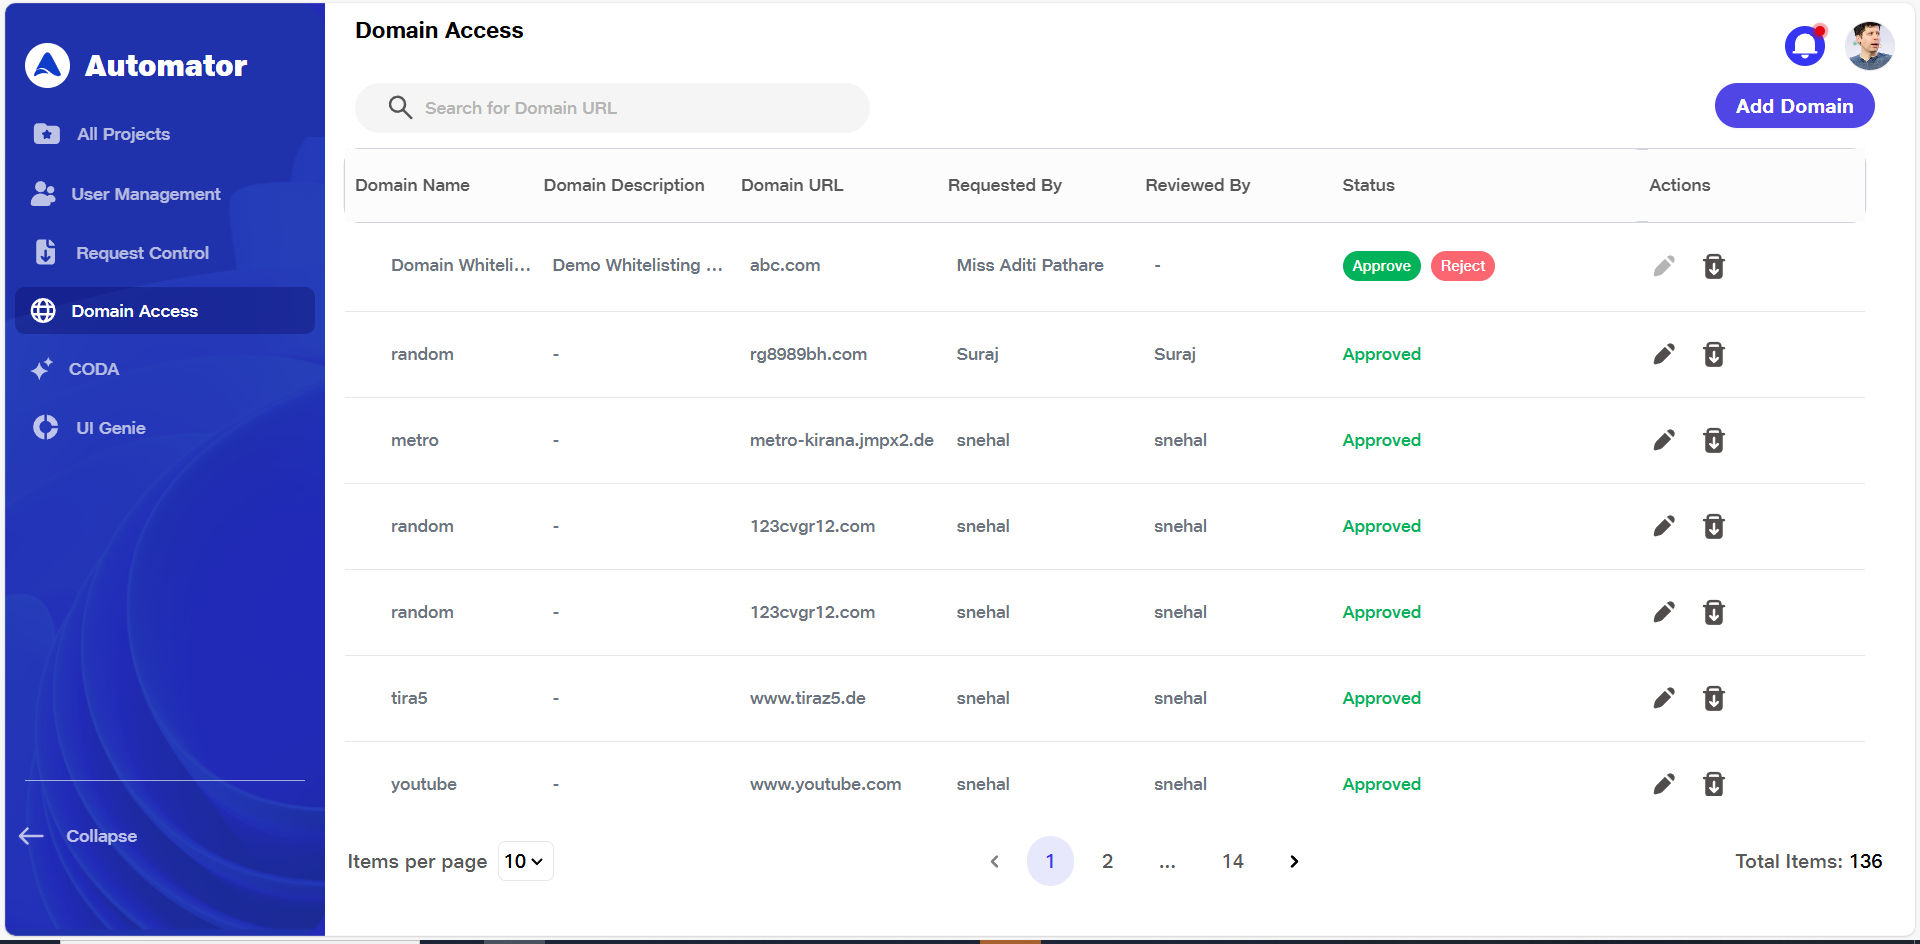 c) The admin can review the domain request and take one of the following actions:
i) Click Approve to approve the domain request.
ii)Click Reject to reject the domain request.
d) If the admin clicks Reject, a prompt will appear requiring them to provide a reason for rejecting the whitelist request.
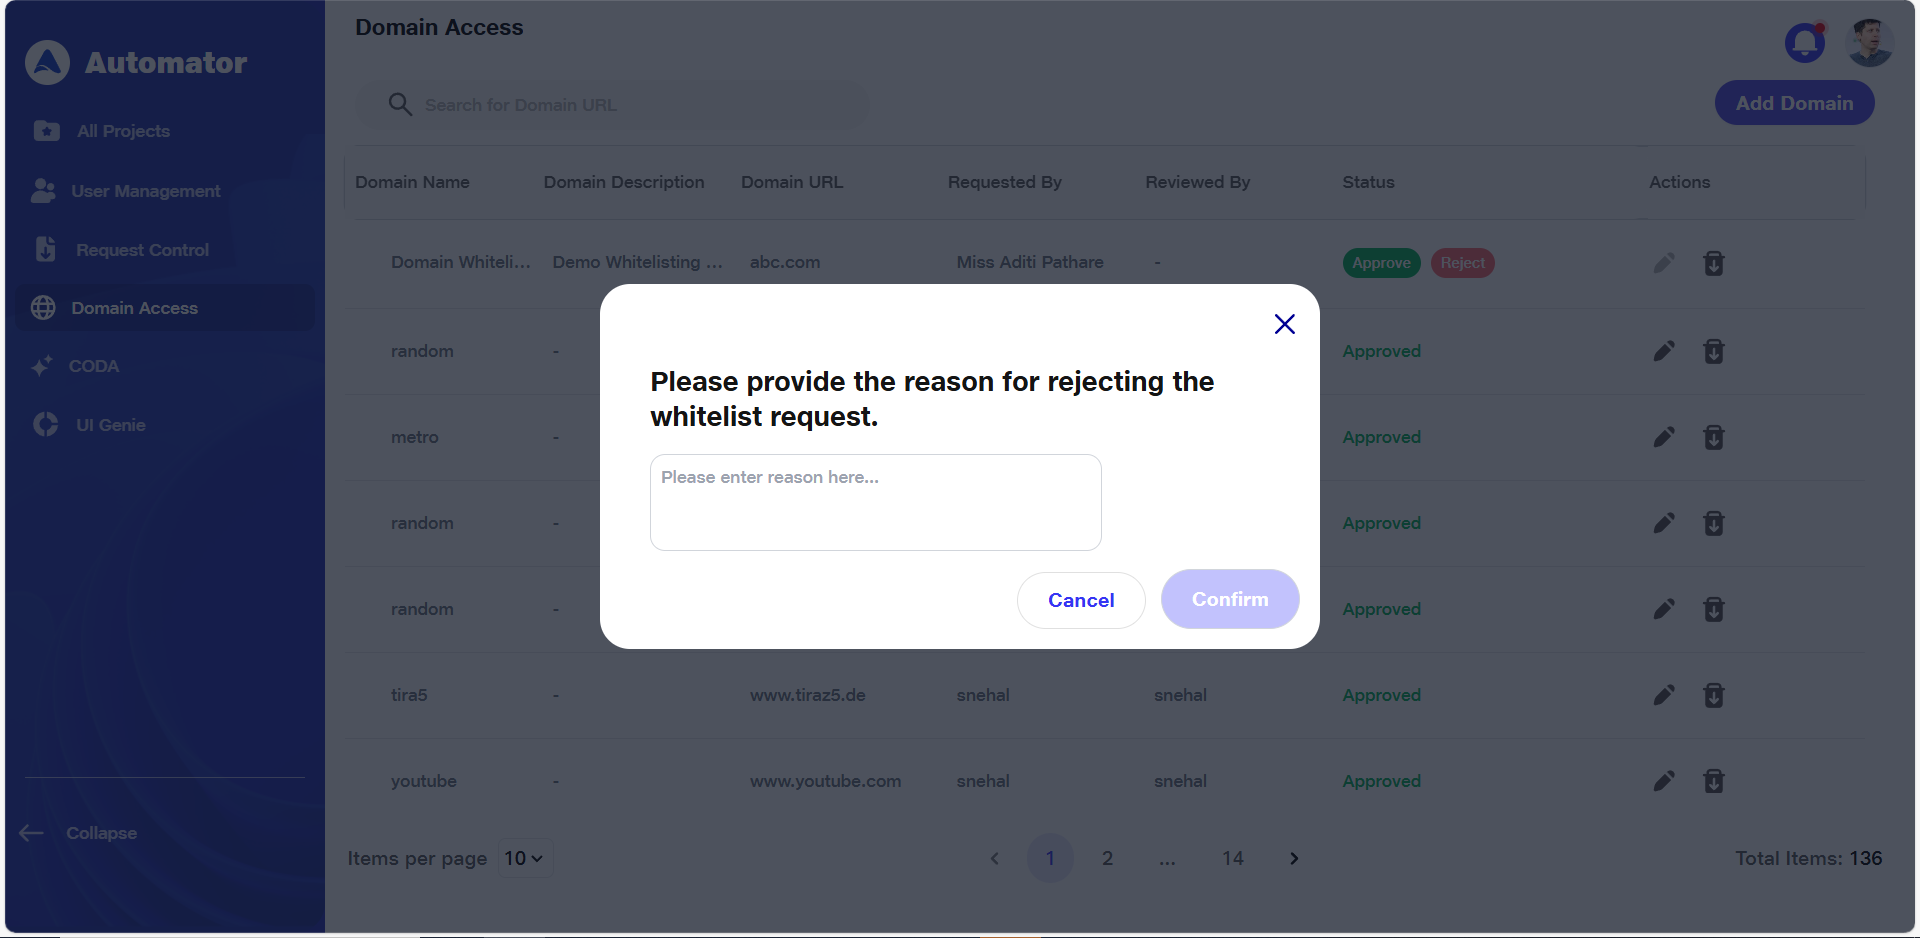 e) After entering the reason and clicking the Confirm button:
i) A toast will appear in the bottom-left corner of the screen with the message: Domain URL request for [Domain_Name] rejected.
ii) The status column of the request will update to Rejected.
iii) An information (i) icon will appear next to the status: When hovering over, it will display the rejection reason provided by the admin.
 f) No further action will be taken unless a new request is submitted.
6) Editing a Whitelisted Domain
a) To modify the details of an existing whitelisted domain, follow these steps:
b) Only Admins have permission to edit domain requests, including those that are already whitelisted. The rejected request becomes read-only and cannot be edited.
c)On the Domain Access page, locate the domain entry you wish to edit.
d) In the Actions column corresponding to that domain, click the Edit icon.
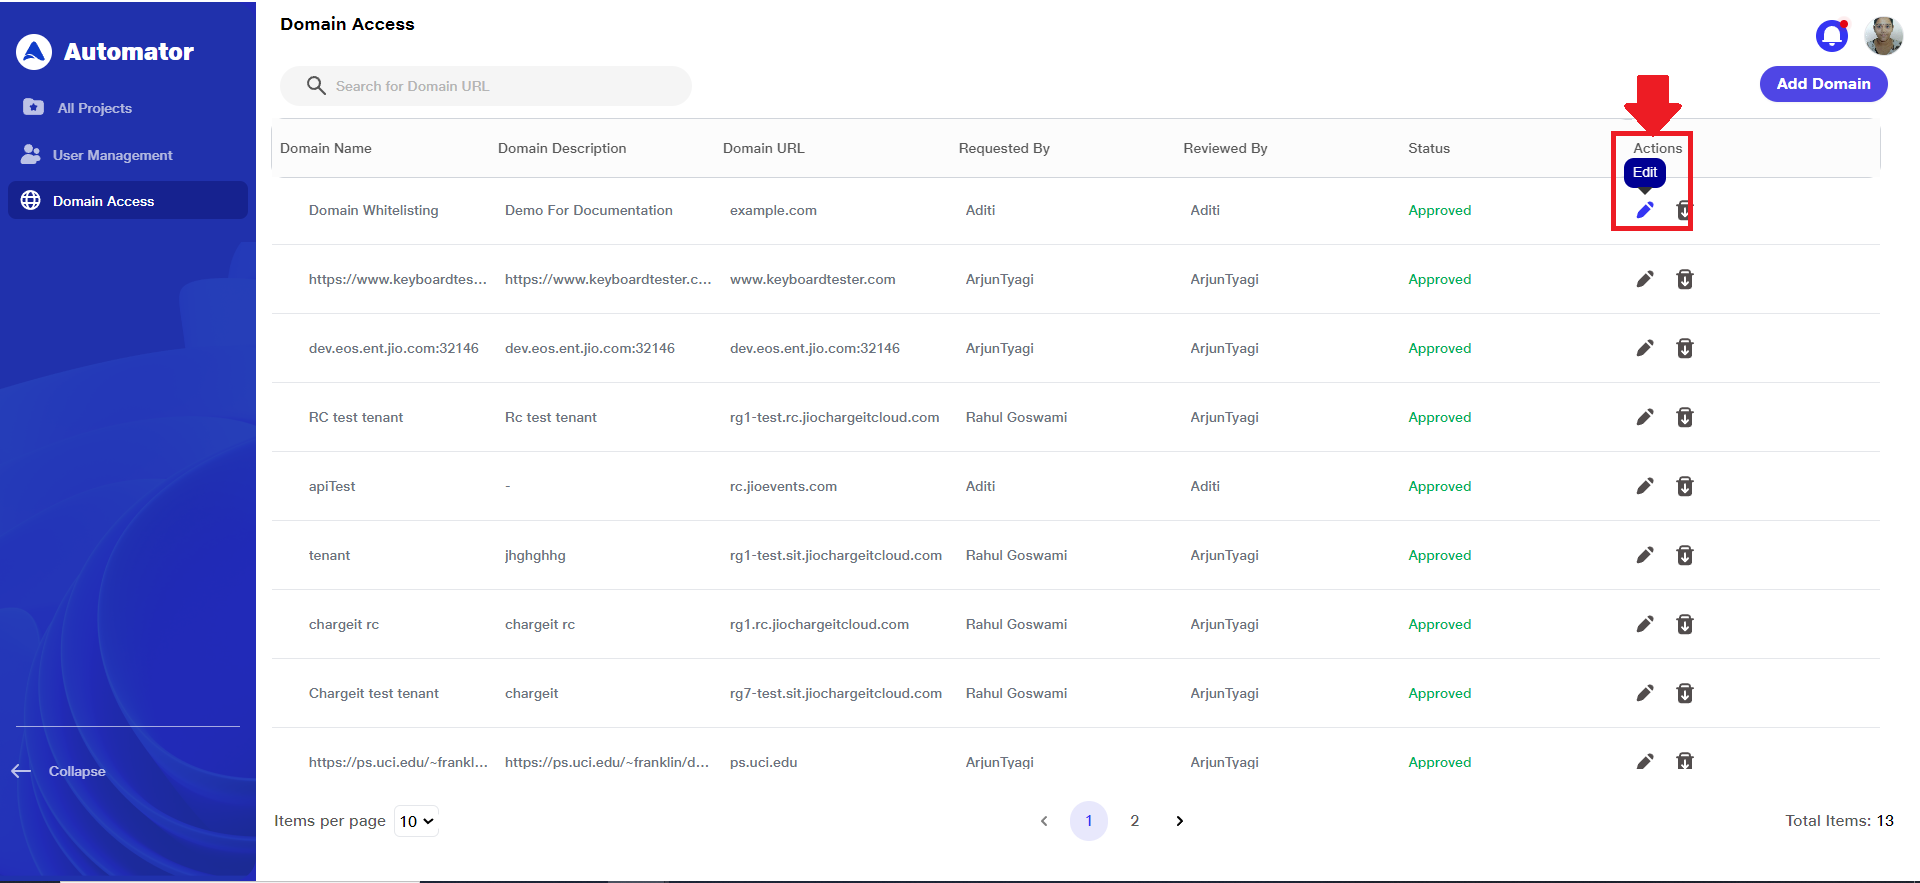 e) An editable form will appear, pre-filled with the current domain details.
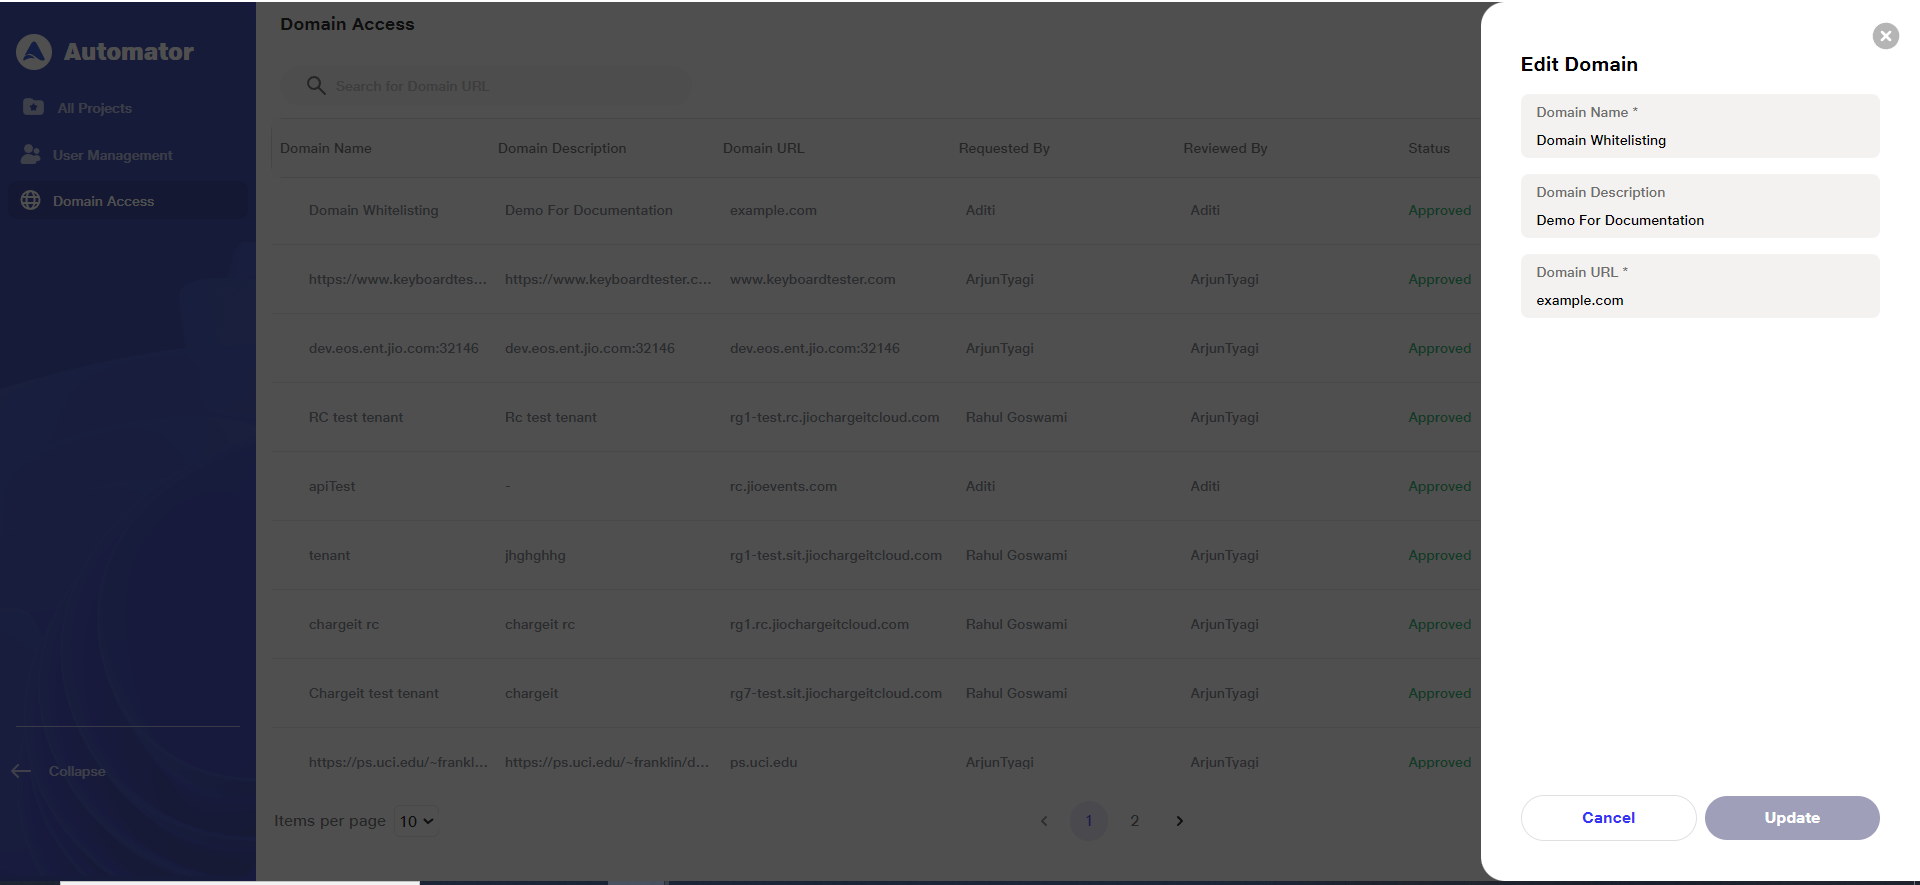 f) Make the necessary changes to any of the following fields:
i)Domain Name
ii)Domain Description
iii)Domain URL
g) After updating the desired information, click the Update button to apply the changes.
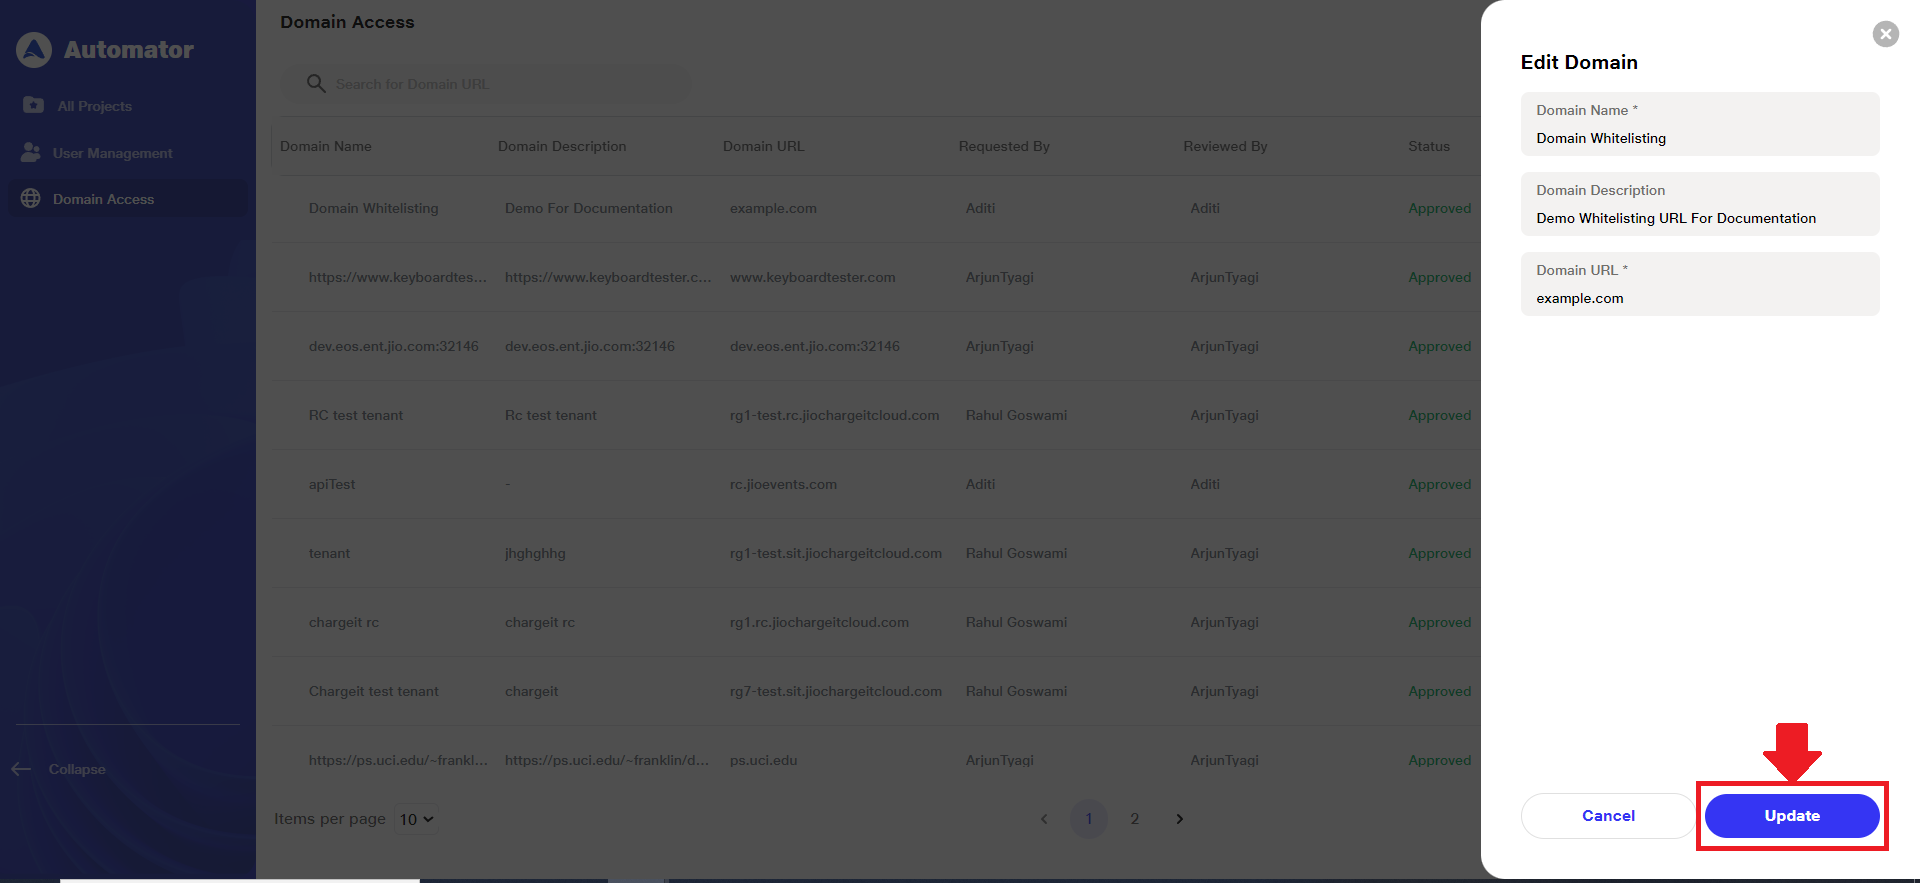 h) Note: Only users with the necessary permissions, i.e. Admins, can edit a whitelisted domain.
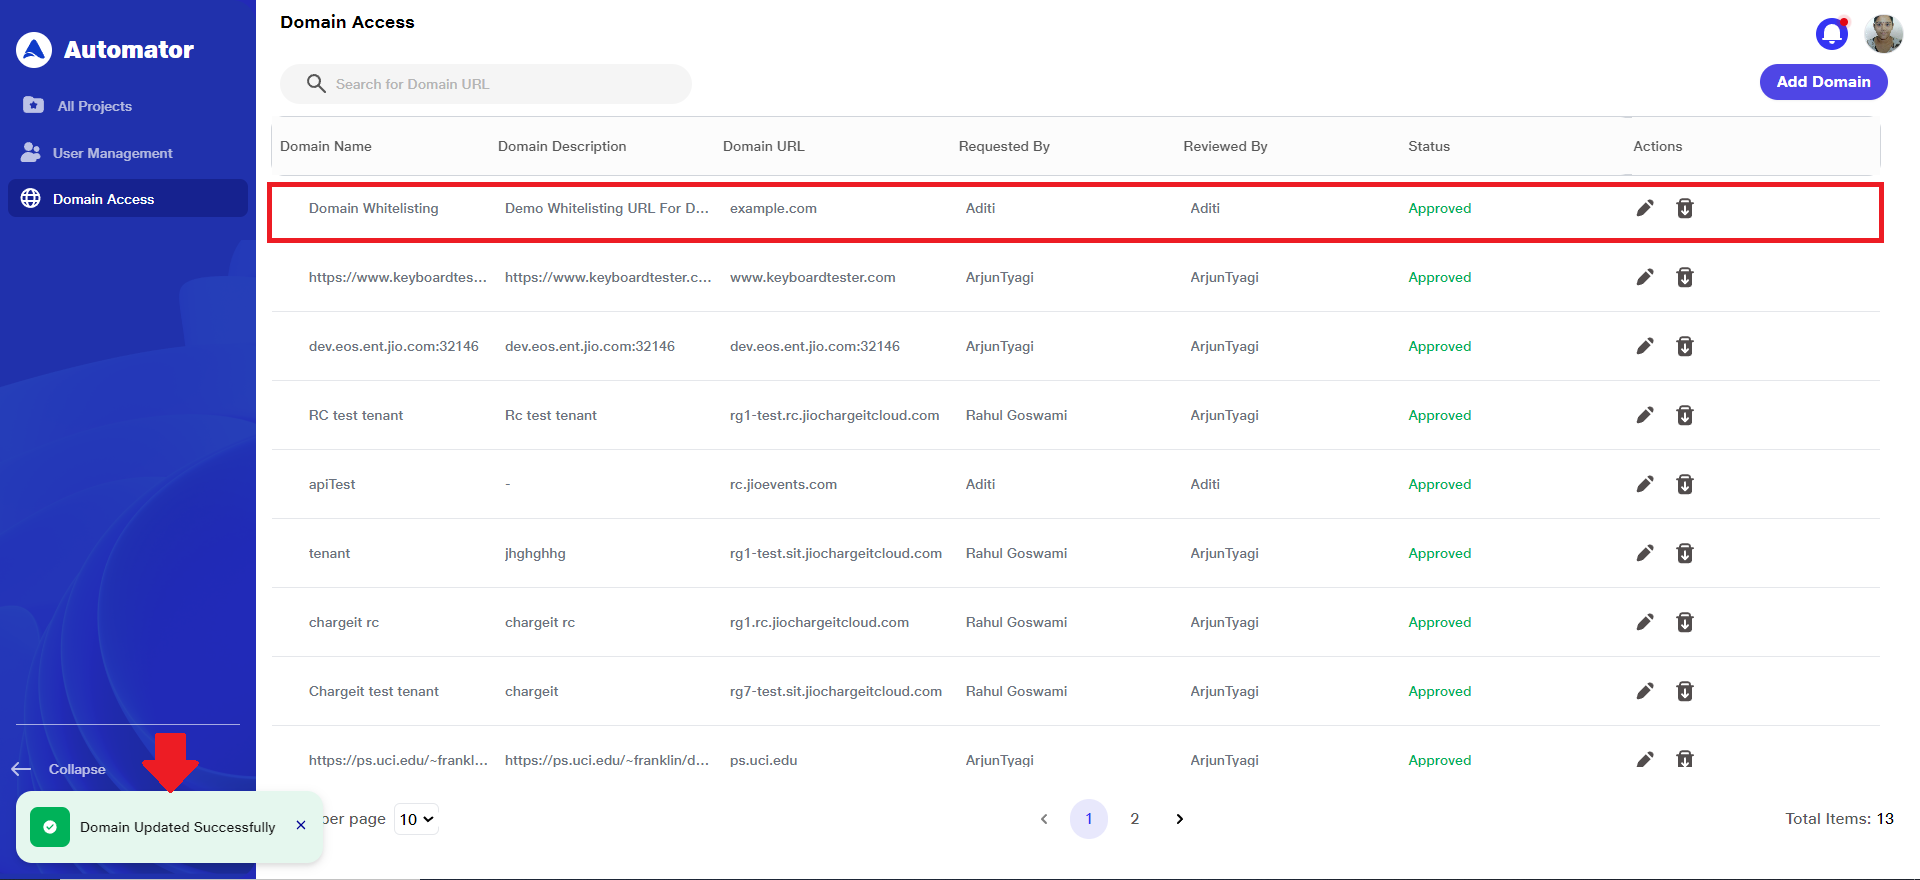
i) Upon successful update, a Domain Updated Successfully confirmation toast will appear at the bottom-left corner of the screen and the updated details will reflect immediately on the domain list. No additional approval is required for edits made by an Admin.
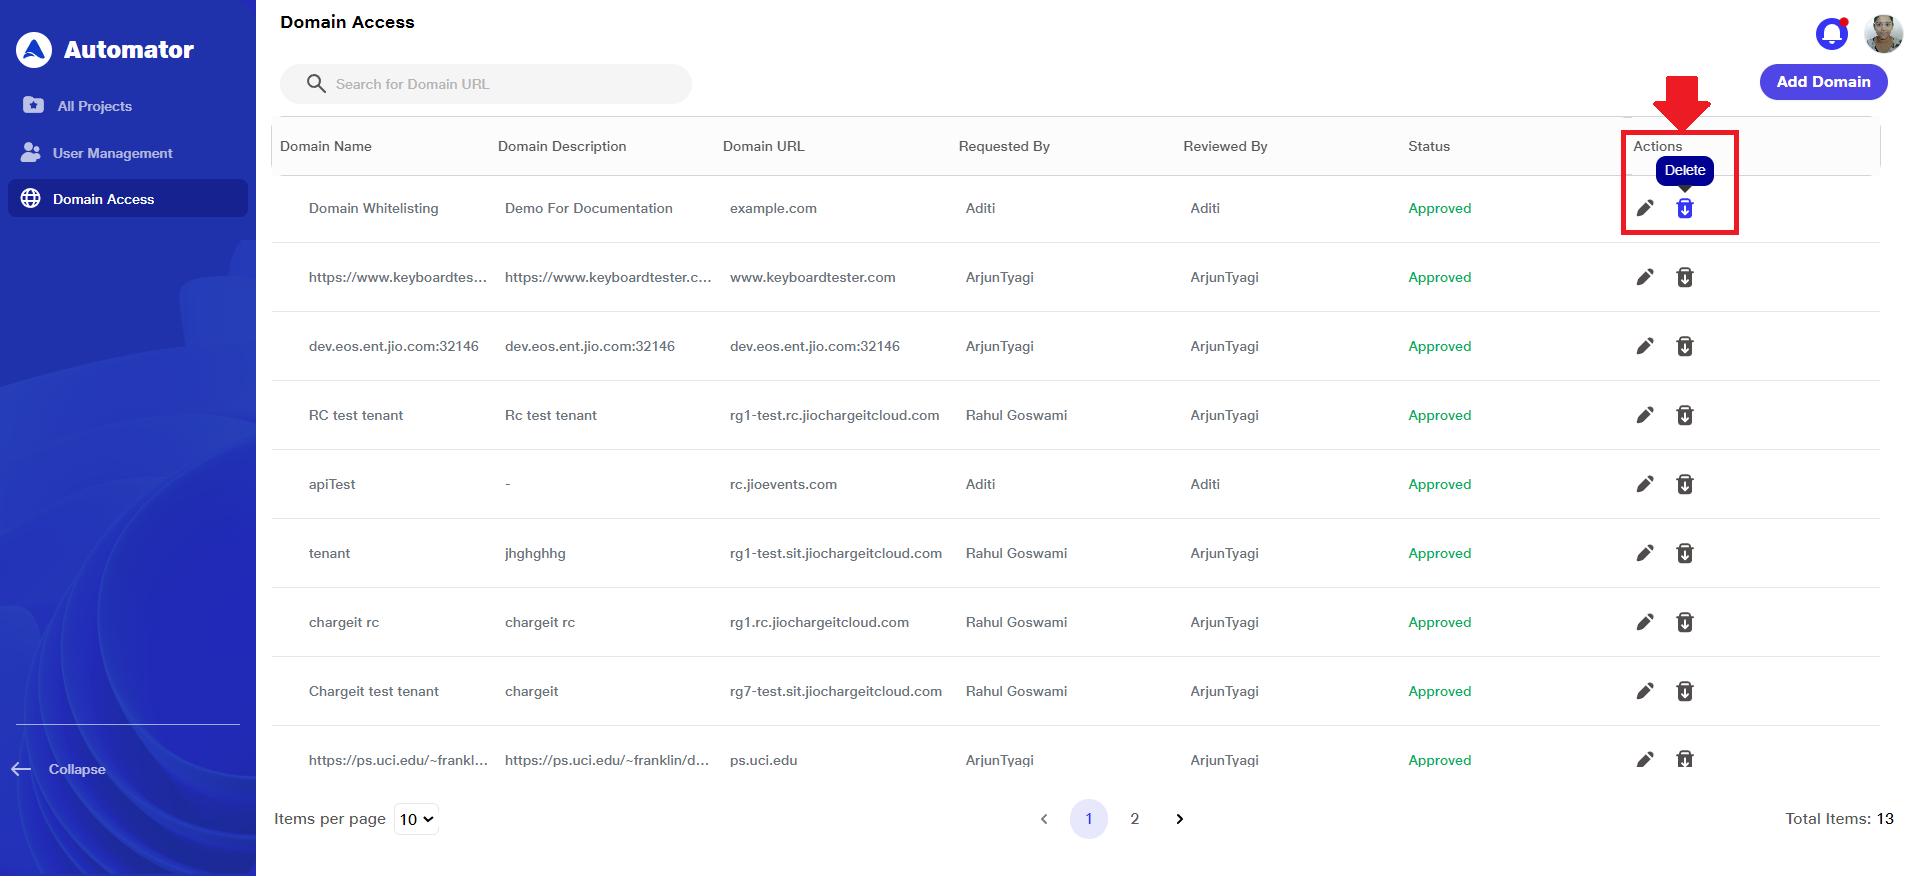
7) Deleting a Whitelisted Domain
a) To remove a domain from the whitelist, follow these steps:
b) Only Admins have permission to delete domain requests.
c) On the Domain Access page, locate the domain entry you wish to delete.
d) In the Actions column corresponding to that domain, click the Delete icon or button.
 e) A confirmation dialog will appear asking you to confirm the deletion.
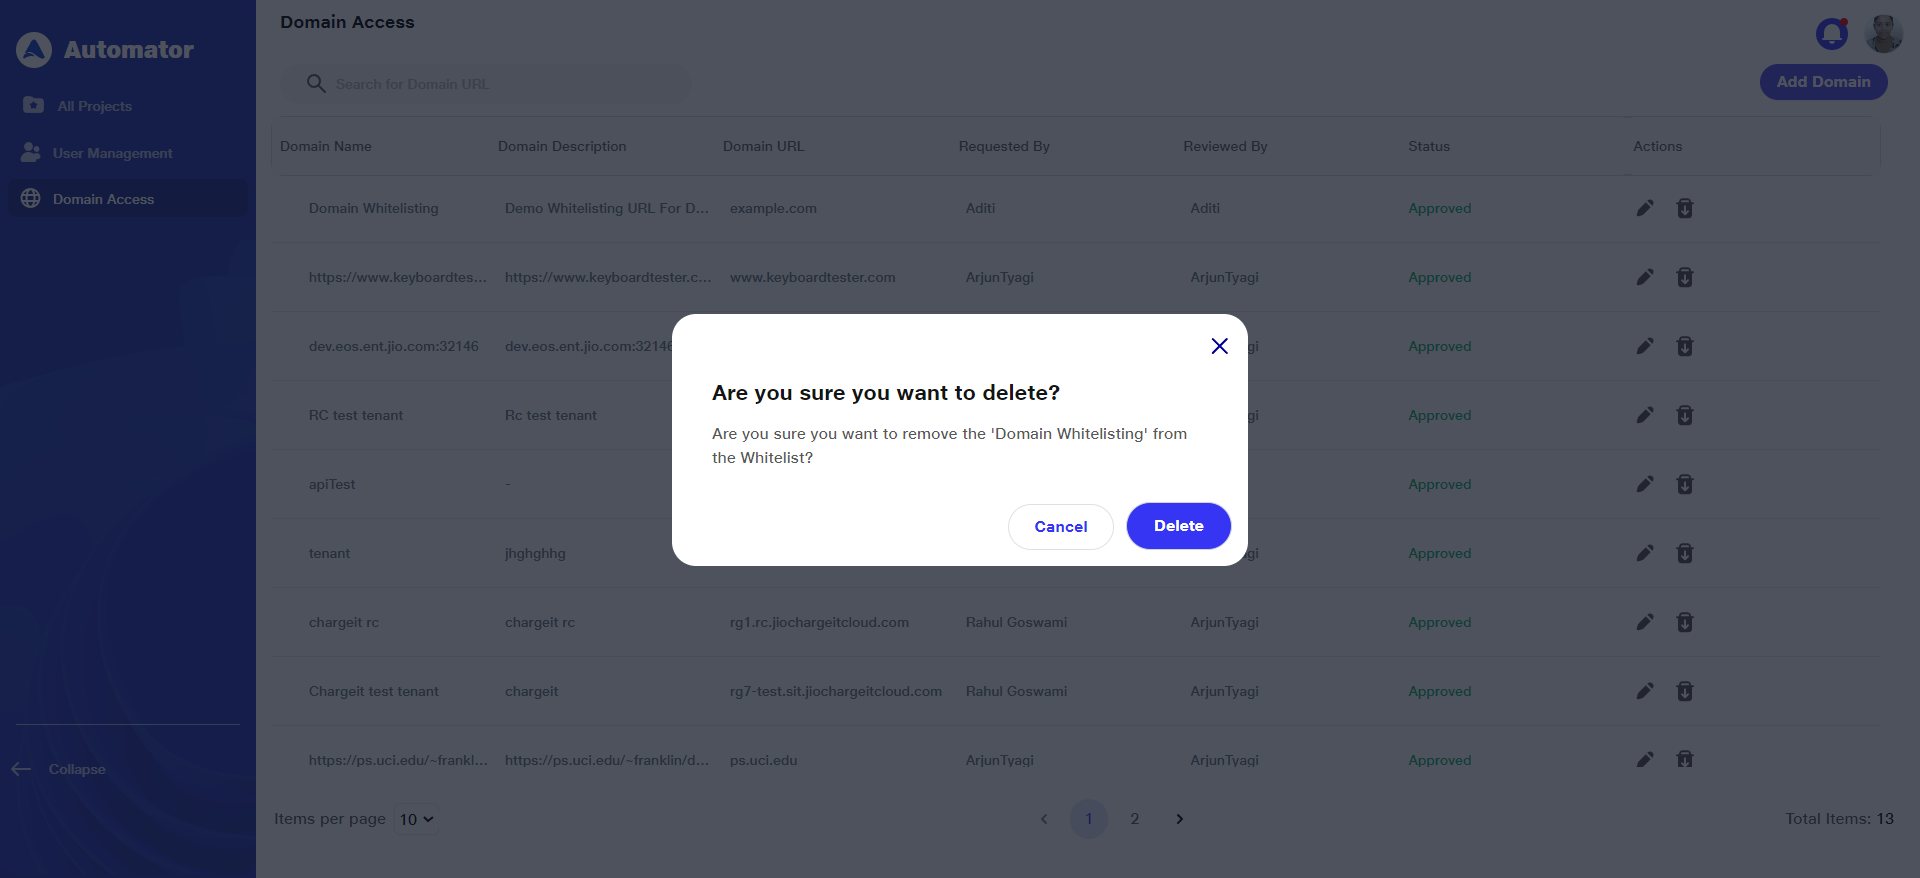 f) Click Delete to proceed with deleting the domain.
g) Upon successful deletion, a Domain Deleted Successfully confirmation popup will appear at the bottom-left corner of the screen.
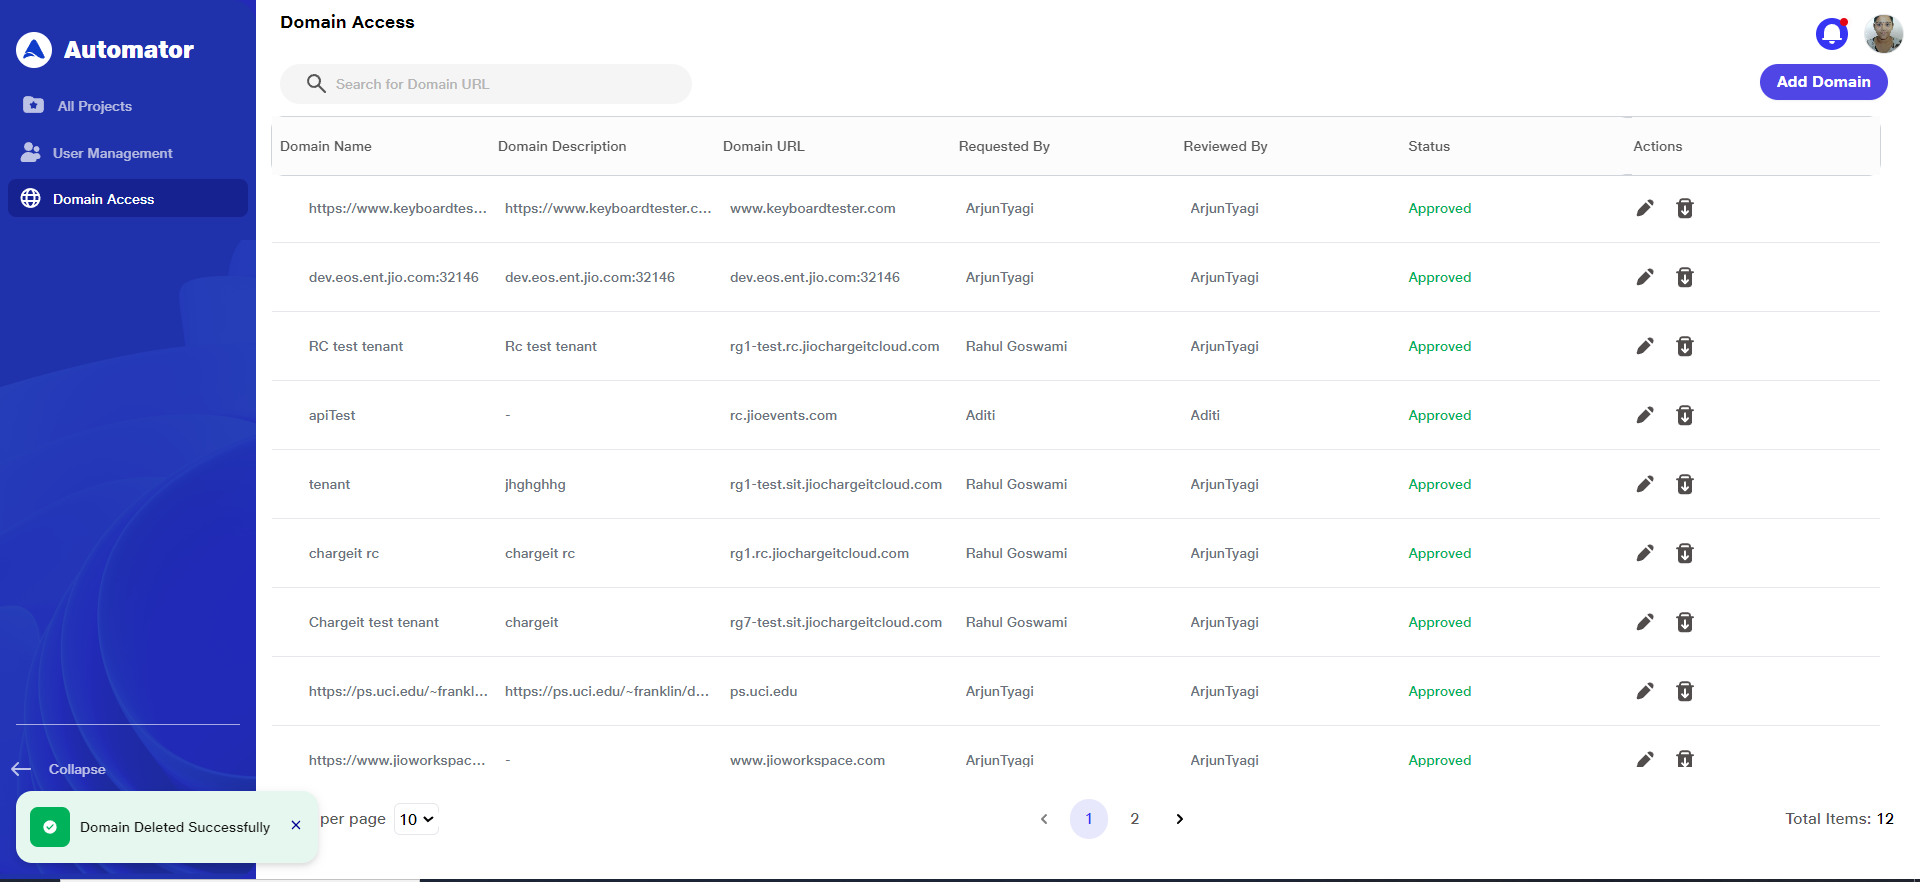 h) Note: Only users with the necessary permissions, i.e., Admins, can delete a whitelisted domain.
i) Once deleted, the domain will be permanently removed from the whitelist and will no longer be available for use within the project.